 Add to Chrome
 Add to Firefox
 Add to Edge
Bridging Natural Language and Interactive What-If Interfaces via LLM-Generated Declarative Specification
Apr 08, 2026What-if analysis (WIA) is an iterative, multi-step process where users explore and compare hypothetical scenarios by adjusting parameters, applying constraints, and scoping data through interactive interfaces. Current tools fall short of supporting effective interactive WIA: spreadsheet and BI tools require time-consuming and laborious setup, while LLM-based chatbot interfaces are semantically fragile, frequently misinterpret intent, and produce inconsistent results as conversations progress. To address these limitations, we present a two-stage workflow that translates natural language (NL) WIA questions into interactive visual interfaces via an intermediate representation, powered by the Praxa Specification Language (PSL): first, LLMs generate PSL specifications from NL questions capturing analytical intent and logic, enabling validation and repair of erroneous specifications; and second, the specifications are compiled into interactive visual interfaces with parameter controls and linked visualizations. We benchmark this workflow with 405 WIA questions spanning 11 WIA types, 5 datasets, and 3 state-of-the-art LLMs. The results show that across models, half of specifications (52.42%) are generated correctly without intervention. We perform an analysis of the failure cases and derive an error taxonomy spanning non-functional errors (specifications fail to compile) and functional errors (specifications compile but misrepresent intent). Based on the taxonomy, we apply targeted repairs on the failure cases using few-shot prompts and improve the success rate to 80.42%. Finally, we show how undetected functional errors propagate through compilation into plausible but misleading interfaces, demonstrating that the intermediate specification is critical for reliably bridging NL and interactive WIA interface in LLM-powered WIA systems.
Data Analysis in the Era of Generative AI
Sep 27, 2024


This paper explores the potential of AI-powered tools to reshape data analysis, focusing on design considerations and challenges. We explore how the emergence of large language and multimodal models offers new opportunities to enhance various stages of data analysis workflow by translating high-level user intentions into executable code, charts, and insights. We then examine human-centered design principles that facilitate intuitive interactions, build user trust, and streamline the AI-assisted analysis workflow across multiple apps. Finally, we discuss the research challenges that impede the development of these AI-based systems such as enhancing model capabilities, evaluating and benchmarking, and understanding end-user needs.
Data Formulator 2: Iteratively Creating Rich Visualizations with AI
Aug 28, 2024


To create rich visualizations, data analysts often need to iterate back and forth among data processing and chart specification to achieve their goals. To achieve this, analysts need not only proficiency in data transformation and visualization tools but also efforts to manage the branching history consisting of many different versions of data and charts. Recent LLM-powered AI systems have greatly improved visualization authoring experiences, for example by mitigating manual data transformation barriers via LLMs' code generation ability. However, these systems do not work well for iterative visualization authoring, because they often require analysts to provide, in a single turn, a text-only prompt that fully describes the complex visualization task to be performed, which is unrealistic to both users and models in many cases. In this paper, we present Data Formulator 2, an LLM-powered visualization system to address these challenges. With Data Formulator 2, users describe their visualization intent with blended UI and natural language inputs, and data transformation are delegated to AI. To support iteration, Data Formulator 2 lets users navigate their iteration history and reuse previous designs towards new ones so that they don't need to start from scratch every time. In a user study with eight participants, we observed that Data Formulator 2 allows participants to develop their own iteration strategies to complete challenging data exploration sessions.
A System for Real-Time Interactive Analysis of Deep Learning Training
Jan 07, 2020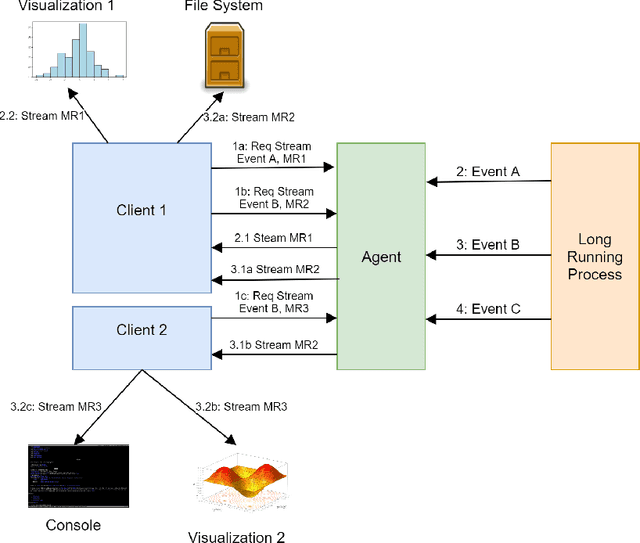
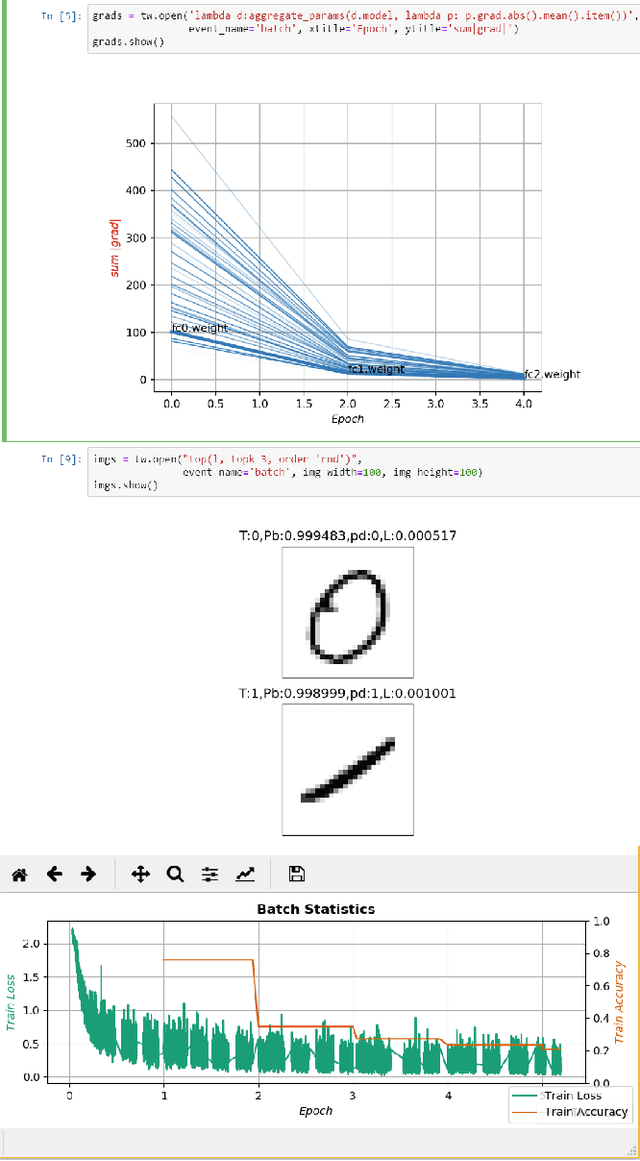
Performing diagnosis or exploratory analysis during the training of deep learning models is challenging but often necessary for making a sequence of decisions guided by the incremental observations. Currently available systems for this purpose are limited to monitoring only the logged data that must be specified before the training process starts. Each time a new information is desired, a cycle of stop-change-restart is required in the training process. These limitations make interactive exploration and diagnosis tasks difficult, imposing long tedious iterations during the model development. We present a new system that enables users to perform interactive queries on live processes generating real-time information that can be rendered in multiple formats on multiple surfaces in the form of several desired visualizations simultaneously. To achieve this, we model various exploratory inspection and diagnostic tasks for deep learning training processes as specifications for streams using a map-reduce paradigm with which many data scientists are already familiar. Our design achieves generality and extensibility by defining composable primitives which is a fundamentally different approach than is used by currently available systems. The open source implementation of our system is available as TensorWatch project at https://github.com/microsoft/tensorwatch.