 Add to Chrome
 Add to Firefox
 Add to Edge
Bridging Natural Language and Interactive What-If Interfaces via LLM-Generated Declarative Specification
Apr 08, 2026What-if analysis (WIA) is an iterative, multi-step process where users explore and compare hypothetical scenarios by adjusting parameters, applying constraints, and scoping data through interactive interfaces. Current tools fall short of supporting effective interactive WIA: spreadsheet and BI tools require time-consuming and laborious setup, while LLM-based chatbot interfaces are semantically fragile, frequently misinterpret intent, and produce inconsistent results as conversations progress. To address these limitations, we present a two-stage workflow that translates natural language (NL) WIA questions into interactive visual interfaces via an intermediate representation, powered by the Praxa Specification Language (PSL): first, LLMs generate PSL specifications from NL questions capturing analytical intent and logic, enabling validation and repair of erroneous specifications; and second, the specifications are compiled into interactive visual interfaces with parameter controls and linked visualizations. We benchmark this workflow with 405 WIA questions spanning 11 WIA types, 5 datasets, and 3 state-of-the-art LLMs. The results show that across models, half of specifications (52.42%) are generated correctly without intervention. We perform an analysis of the failure cases and derive an error taxonomy spanning non-functional errors (specifications fail to compile) and functional errors (specifications compile but misrepresent intent). Based on the taxonomy, we apply targeted repairs on the failure cases using few-shot prompts and improve the success rate to 80.42%. Finally, we show how undetected functional errors propagate through compilation into plausible but misleading interfaces, demonstrating that the intermediate specification is critical for reliably bridging NL and interactive WIA interface in LLM-powered WIA systems.
Augmenting Decision Making via Interactive What-If Analysis
Sep 21, 2021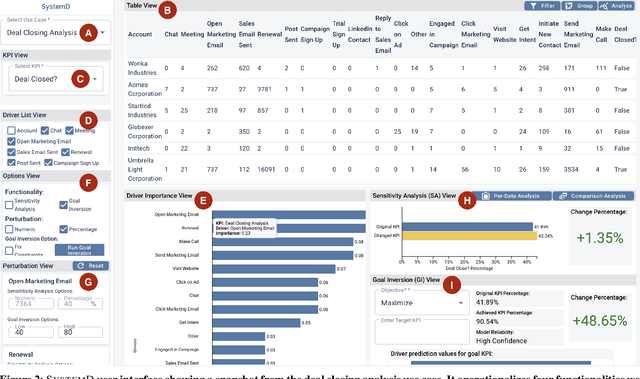
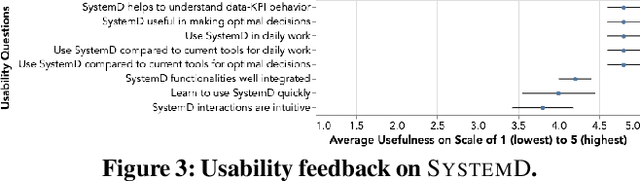
The fundamental goal of business data analysis is to improve business decisions using data. Business users such as sales, marketing, product, or operations managers often make decisions to achieve key performance indicator (KPI) goals such as increasing customer retention, decreasing cost, and increasing sales. To discover the relationship between data attributes hypothesized to be drivers and those corresponding to KPIs of interest, business users currently need to perform lengthy exploratory analyses, considering multitudes of combinations and scenarios, slicing, dicing, and transforming the data accordingly. For example, analyzing customer retention across quarters of the year or suggesting optimal media channels across strata of customers. However, the increasing complexity of datasets combined with the cognitive limitations of humans makes it challenging to carry over multiple hypotheses, even for simple datasets. Therefore mentally performing such analyses is hard. Existing commercial tools either provide partial solutions whose effectiveness remains unclear or fail to cater to business users. Here we argue for four functionalities that we believe are necessary to enable business users to interactively learn and reason about the relationships (functions) between sets of data attributes, facilitating data-driven decision making. We implement these functionalities in SystemD, an interactive visual analysis system enabling business users to experiment with the data by asking what-if questions. We evaluate the system through three business use cases: marketing mix modeling analysis, customer retention analysis, and deal closing analysis, and report on feedback from multiple business users. Overall, business users find SystemD intuitive and useful for quick testing and validation of their hypotheses around interested KPI as well as in making effective and fast data-driven decisions.
Making Table Understanding Work in Practice
Sep 11, 2021
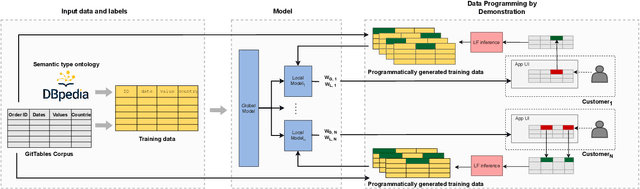
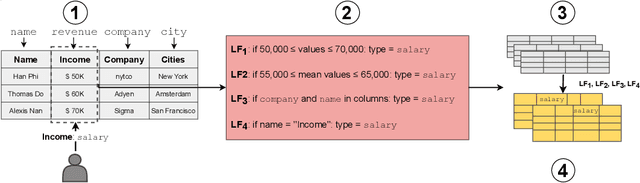
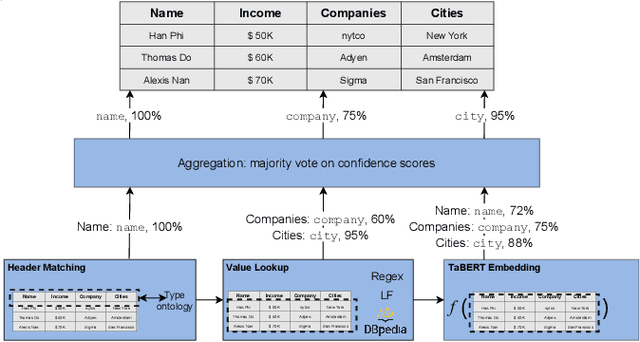
Understanding the semantics of tables at scale is crucial for tasks like data integration, preparation, and search. Table understanding methods aim at detecting a table's topic, semantic column types, column relations, or entities. With the rise of deep learning, powerful models have been developed for these tasks with excellent accuracy on benchmarks. However, we observe that there exists a gap between the performance of these models on these benchmarks and their applicability in practice. In this paper, we address the question: what do we need for these models to work in practice? We discuss three challenges of deploying table understanding models and propose a framework to address them. These challenges include 1) difficulty in customizing models to specific domains, 2) lack of training data for typical database tables often found in enterprises, and 3) lack of confidence in the inferences made by models. We present SigmaTyper which implements this framework for the semantic column type detection task. SigmaTyper encapsulates a hybrid model trained on GitTables and integrates a lightweight human-in-the-loop approach to customize the model. Lastly, we highlight avenues for future research that further close the gap towards making table understanding effective in practice.