 Add to Chrome
 Add to Firefox
 Add to Edge
Training LLMs with Fault Tolerant HSDP on 100,000 GPUs
Jan 30, 2026Large-scale training systems typically use synchronous training, requiring all GPUs to be healthy simultaneously. In our experience training on O(100K) GPUs, synchronous training results in a low efficiency due to frequent failures and long recovery time. To address this problem, we propose a novel training paradigm, Fault Tolerant Hybrid-Shared Data Parallelism (FT-HSDP). FT-HSDP uses data parallel replicas as units of fault tolerance. When failures occur, only a single data-parallel replica containing the failed GPU or server is taken offline and restarted, while the other replicas continue training. To realize this idea at scale, FT-HSDP incorporates several techniques: 1) We introduce a Fault Tolerant All Reduce (FTAR) protocol for gradient exchange across data parallel replicas. FTAR relies on the CPU to drive the complex control logic for tasks like adding or removing participants dynamically, and relies on GPU to perform data transfer for best performance. 2) We introduce a non-blocking catch-up protocol, allowing a recovering replica to join training with minimal stall. Compared with fully synchronous training at O(100K) GPUs, FT-HSDP can reduce the stall time due to failure recovery from 10 minutes to 3 minutes, increasing effective training time from 44\% to 80\%. We further demonstrate that FT-HSDP's asynchronous recovery does not bring any meaning degradation to the accuracy of the result model.
The Llama 4 Herd: Architecture, Training, Evaluation, and Deployment Notes
Jan 15, 2026This document consolidates publicly reported technical details about Metas Llama 4 model family. It summarizes (i) released variants (Scout and Maverick) and the broader herd context including the previewed Behemoth teacher model, (ii) architectural characteristics beyond a high-level MoE description covering routed/shared-expert structure, early-fusion multimodality, and long-context design elements reported for Scout (iRoPE and length generalization strategies), (iii) training disclosures spanning pre-training, mid-training for long-context extension, and post-training methodology (lightweight SFT, online RL, and lightweight DPO) as described in release materials, (iv) developer-reported benchmark results for both base and instruction-tuned checkpoints, and (v) practical deployment constraints observed across major serving environments, including provider-specific context limits and quantization packaging. The manuscript also summarizes licensing obligations relevant to redistribution and derivative naming, and reviews publicly described safeguards and evaluation practices. The goal is to provide a compact technical reference for researchers and practitioners who need precise, source-backed facts about Llama 4.
PyTorch FSDP: Experiences on Scaling Fully Sharded Data Parallel
Apr 21, 2023It is widely acknowledged that large models have the potential to deliver superior performance across a broad range of domains. Despite the remarkable progress made in the field of machine learning systems research, which has enabled the development and exploration of large models, such abilities remain confined to a small group of advanced users and industry leaders, resulting in an implicit technical barrier for the wider community to access and leverage these technologies. In this paper, we introduce PyTorch Fully Sharded Data Parallel (FSDP) as an industry-grade solution for large model training. FSDP has been closely co-designed with several key PyTorch core components including Tensor implementation, dispatcher system, and CUDA memory caching allocator, to provide non-intrusive user experiences and high training efficiency. Additionally, FSDP natively incorporates a range of techniques and settings to optimize resource utilization across a variety of hardware configurations. The experimental results demonstrate that FSDP is capable of achieving comparable performance to Distributed Data Parallel while providing support for significantly larger models with near-linear scalability in terms of TFLOPS.
PyTorch Distributed: Experiences on Accelerating Data Parallel Training
Jun 28, 2020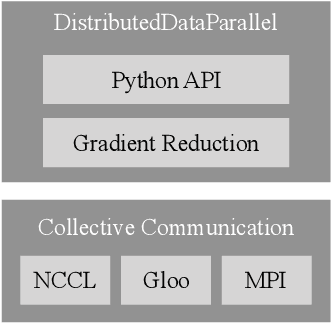
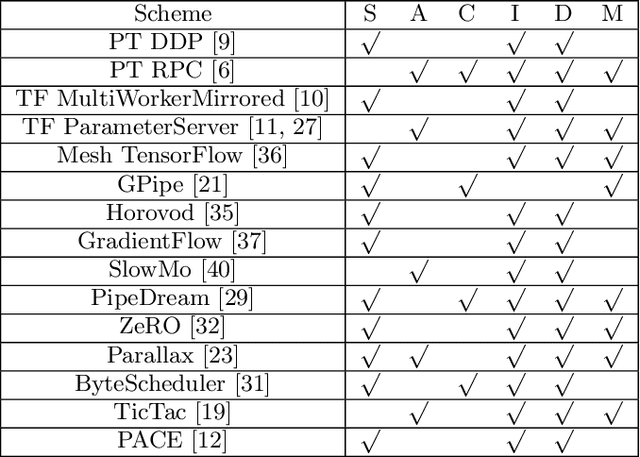
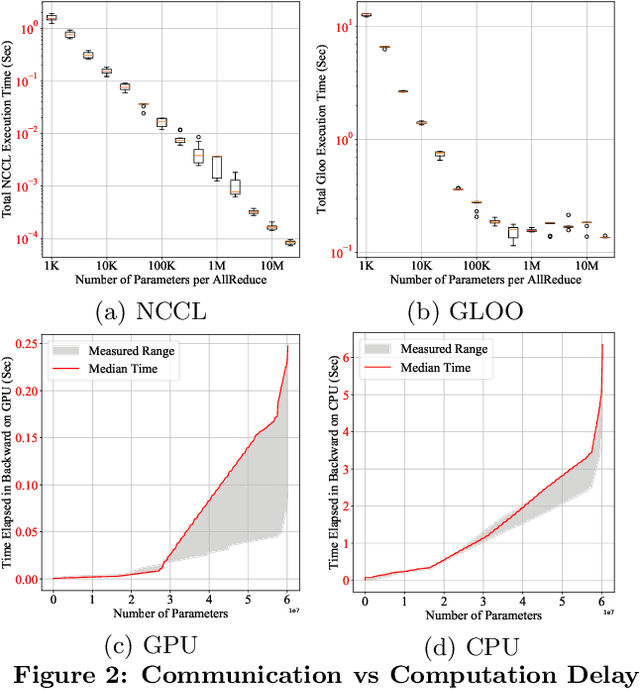
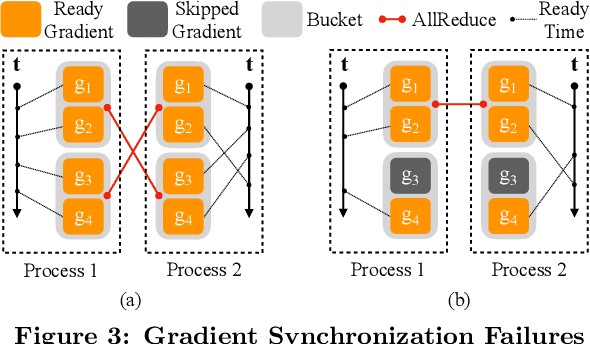
This paper presents the design, implementation, and evaluation of the PyTorch distributed data parallel module. PyTorch is a widely-adopted scientific computing package used in deep learning research and applications. Recent advances in deep learning argue for the value of large datasets and large models, which necessitates the ability to scale out model training to more computational resources. Data parallelism has emerged as a popular solution for distributed training thanks to its straightforward principle and broad applicability. In general, the technique of distributed data parallelism replicates the model on every computational resource to generate gradients independently and then communicates those gradients at each iteration to keep model replicas consistent. Despite the conceptual simplicity of the technique, the subtle dependencies between computation and communication make it non-trivial to optimize the distributed training efficiency. As of v1.5, PyTorch natively provides several techniques to accelerate distributed data parallel, including bucketing gradients, overlapping computation with communication, and skipping gradient synchronization. Evaluations show that, when configured appropriately, the PyTorch distributed data parallel module attains near-linear scalability using 256 GPUs.
Vector-Valued Graph Trend Filtering with Non-Convex Penalties
May 29, 2019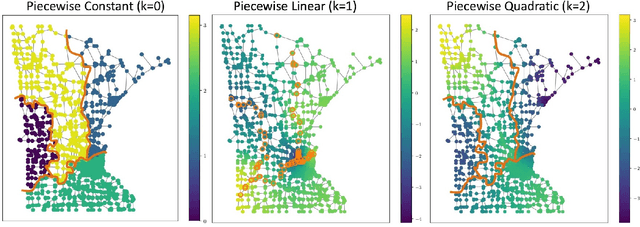
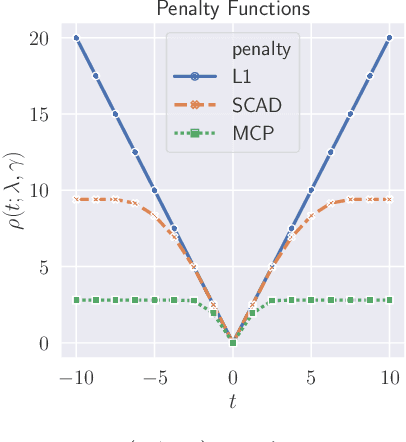
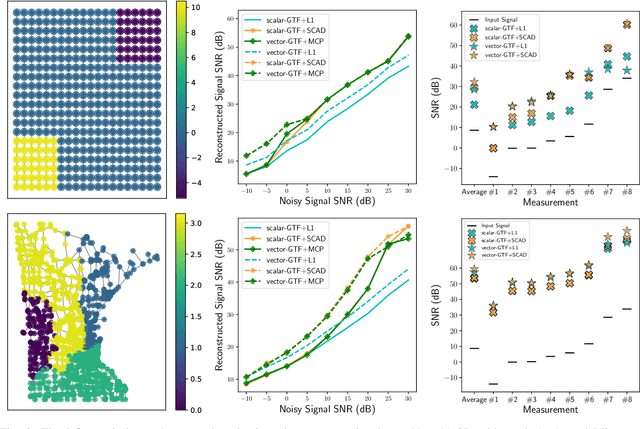
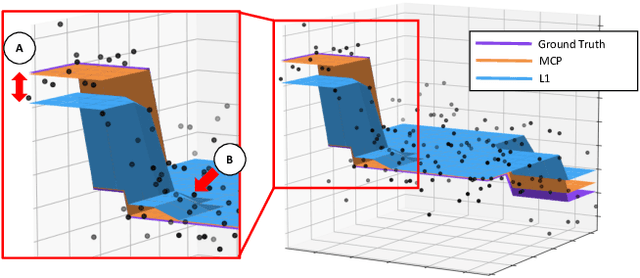
We study the denoising of piecewise smooth graph signals that exhibit inhomogeneous levels of smoothness over a graph, where the value at each node can be vector-valued. We extend the graph trend filtering framework to denoising vector-valued graph signals with a family of non-convex regularizers that exhibit superior recovery performance over existing convex regularizers. We establish the statistical error rates of first-order stationary points of the proposed non-convex method for generic graphs using oracle inequalities. We further present an ADMM-based algorithm to solve the proposed method and analyze its convergence. We present numerical experiments on both synthetic and real-world data for denoising, support recovery, and semi-supervised classification.
Sampling Theory for Graph Signals on Product Graphs
Sep 26, 2018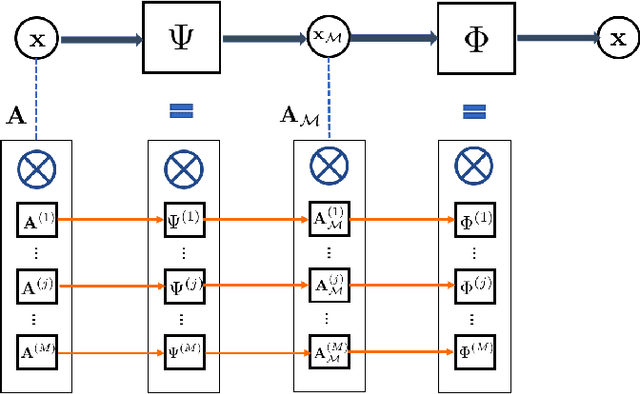
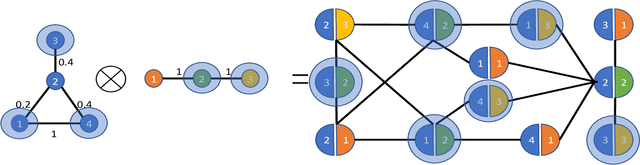
In this paper, we extend the sampling theory on graphs by constructing a framework that exploits the structure in product graphs for efficient sampling and recovery of bandlimited graph signals that lie on them. Product graphs are graphs that are composed from smaller graph atoms; we motivate how this model is a flexible and useful way to model richer classes of data that can be multi-modal in nature. Previous works have established a sampling theory on graphs for bandlimited signals. Importantly, the framework achieves significant savings in both sample complexity and computational complexity
A statistical perspective of sampling scores for linear regression
Feb 10, 2016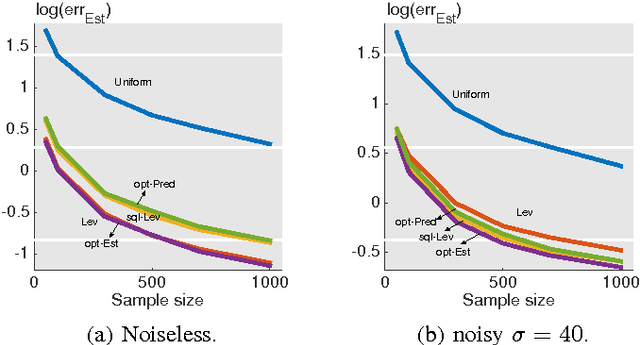
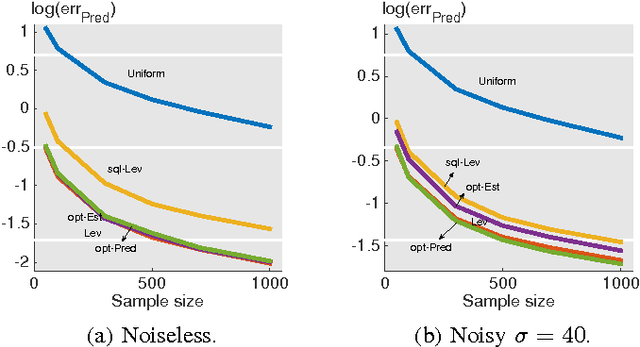
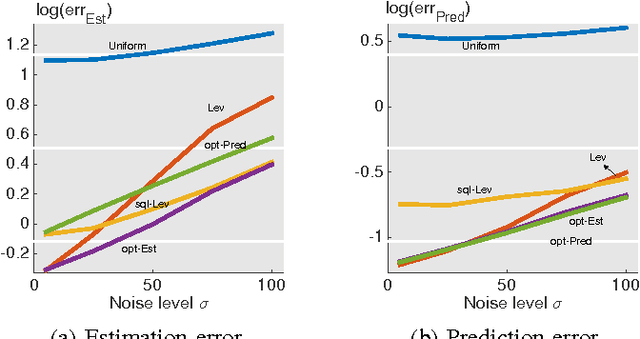
In this paper, we consider a statistical problem of learning a linear model from noisy samples. Existing work has focused on approximating the least squares solution by using leverage-based scores as an importance sampling distribution. However, no finite sample statistical guarantees and no computationally efficient optimal sampling strategies have been proposed. To evaluate the statistical properties of different sampling strategies, we propose a simple yet effective estimator, which is easy for theoretical analysis and is useful in multitask linear regression. We derive the exact mean square error of the proposed estimator for any given sampling scores. Based on minimizing the mean square error, we propose the optimal sampling scores for both estimator and predictor, and show that they are influenced by the noise-to-signal ratio. Numerical simulations match the theoretical analysis well.
Signal Representations on Graphs: Tools and Applications
Dec 16, 2015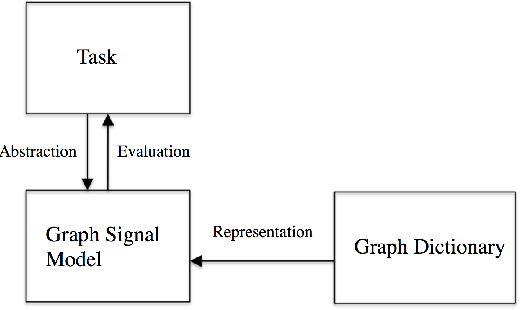
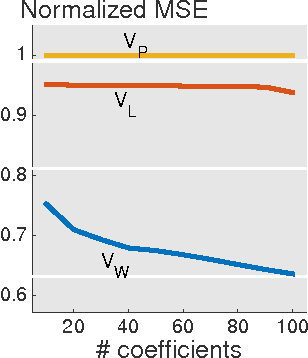
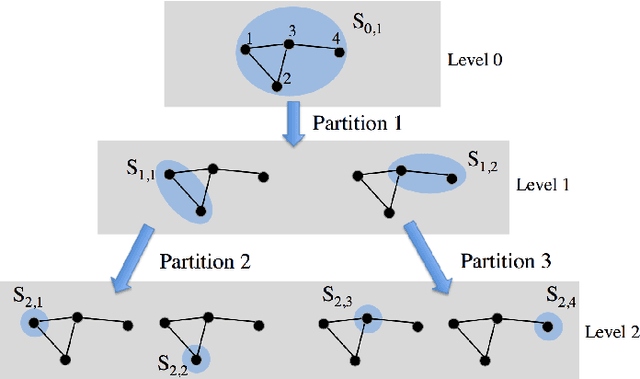
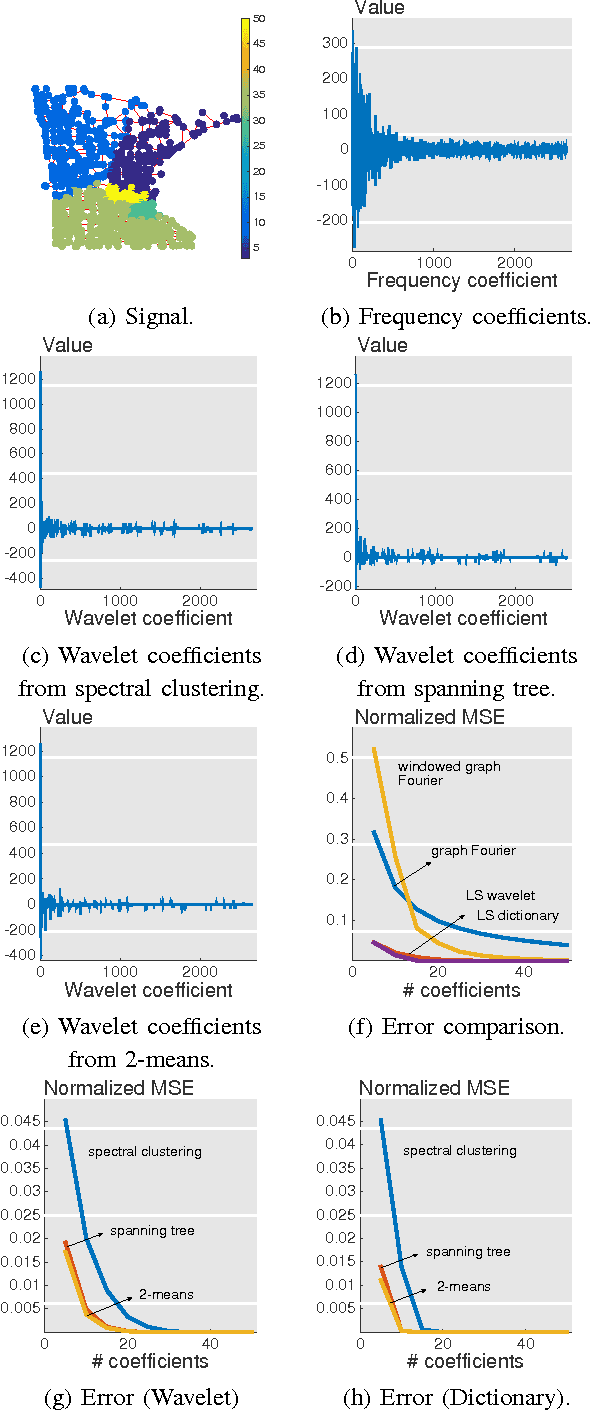
We present a framework for representing and modeling data on graphs. Based on this framework, we study three typical classes of graph signals: smooth graph signals, piecewise-constant graph signals, and piecewise-smooth graph signals. For each class, we provide an explicit definition of the graph signals and construct a corresponding graph dictionary with desirable properties. We then study how such graph dictionary works in two standard tasks: approximation and sampling followed with recovery, both from theoretical as well as algorithmic perspectives. Finally, for each class, we present a case study of a real-world problem by using the proposed methodology.
Signal Recovery on Graphs: Random versus Experimentally Designed Sampling
May 29, 2015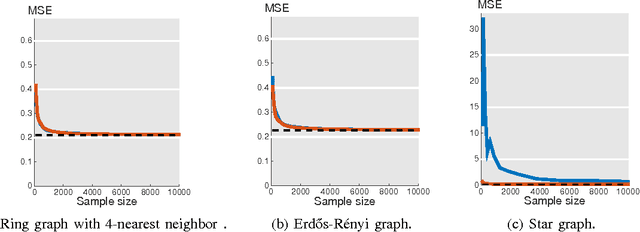
We study signal recovery on graphs based on two sampling strategies: random sampling and experimentally designed sampling. We propose a new class of smooth graph signals, called approximately bandlimited, which generalizes the bandlimited class and is similar to the globally smooth class. We then propose two recovery strategies based on random sampling and experimentally designed sampling. The proposed recovery strategy based on experimentally designed sampling is similar to the leverage scores used in the matrix approximation. We show that while both strategies are unbiased estimators for the low-frequency components, the convergence rate of experimentally designed sampling is much faster than that of random sampling when a graph is irregular. We validate the proposed recovery strategies on three specific graphs: a ring graph, an Erd\H{o}s-R\'enyi graph, and a star graph. The simulation results support the theoretical analysis.