 Add to Chrome
 Add to Firefox
 Add to Edge
AI Steerability 360: A Toolkit for Steering Large Language Models
Mar 08, 2026The AI Steerability 360 toolkit is an extensible, open-source Python library for steering LLMs. Steering abstractions are designed around four model control surfaces: input (modification of the prompt), structural (modification of the model's weights or architecture), state (modification of the model's activations and attentions), and output (modification of the decoding or generation process). Steering methods exert control on the model through a common interface, termed a steering pipeline, which additionally allows for the composition of multiple steering methods. Comprehensive evaluation and comparison of steering methods/pipelines is facilitated by use case classes (for defining tasks) and a benchmark class (for performance comparison on a given task). The functionality provided by the toolkit significantly lowers the barrier to developing and comprehensively evaluating steering methods. The toolkit is Hugging Face native and is released under an Apache 2.0 license at https://github.com/IBM/AISteer360.
Reasoning about concepts with LLMs: Inconsistencies abound
May 30, 2024


The ability to summarize and organize knowledge into abstract concepts is key to learning and reasoning. Many industrial applications rely on the consistent and systematic use of concepts, especially when dealing with decision-critical knowledge. However, we demonstrate that, when methodically questioned, large language models (LLMs) often display and demonstrate significant inconsistencies in their knowledge. Computationally, the basic aspects of the conceptualization of a given domain can be represented as Is-A hierarchies in a knowledge graph (KG) or ontology, together with a few properties or axioms that enable straightforward reasoning. We show that even simple ontologies can be used to reveal conceptual inconsistencies across several LLMs. We also propose strategies that domain experts can use to evaluate and improve the coverage of key domain concepts in LLMs of various sizes. In particular, we have been able to significantly enhance the performance of LLMs of various sizes with openly available weights using simple knowledge-graph (KG) based prompting strategies.
Alignment Studio: Aligning Large Language Models to Particular Contextual Regulations
Mar 08, 2024The alignment of large language models is usually done by model providers to add or control behaviors that are common or universally understood across use cases and contexts. In contrast, in this article, we present an approach and architecture that empowers application developers to tune a model to their particular values, social norms, laws and other regulations, and orchestrate between potentially conflicting requirements in context. We lay out three main components of such an Alignment Studio architecture: Framers, Instructors, and Auditors that work in concert to control the behavior of a language model. We illustrate this approach with a running example of aligning a company's internal-facing enterprise chatbot to its business conduct guidelines.
Ranking Large Language Models without Ground Truth
Feb 21, 2024


Evaluation and ranking of large language models (LLMs) has become an important problem with the proliferation of these models and their impact. Evaluation methods either require human responses which are expensive to acquire or use pairs of LLMs to evaluate each other which can be unreliable. In this paper, we provide a novel perspective where, given a dataset of prompts (viz. questions, instructions, etc.) and a set of LLMs, we rank them without access to any ground truth or reference responses. Inspired by real life where both an expert and a knowledgeable person can identify a novice our main idea is to consider triplets of models, where each one of them evaluates the other two, correctly identifying the worst model in the triplet with high probability. We also analyze our idea and provide sufficient conditions for it to succeed. Applying this idea repeatedly, we propose two methods to rank LLMs. In experiments on different generative tasks (summarization, multiple-choice, and dialog), our methods reliably recover close to true rankings without reference data. This points to a viable low-resource mechanism for practical use.
SocialStigmaQA: A Benchmark to Uncover Stigma Amplification in Generative Language Models
Dec 27, 2023Current datasets for unwanted social bias auditing are limited to studying protected demographic features such as race and gender. In this work, we introduce a comprehensive benchmark that is meant to capture the amplification of social bias, via stigmas, in generative language models. Taking inspiration from social science research, we start with a documented list of 93 US-centric stigmas and curate a question-answering (QA) dataset which involves simple social situations. Our benchmark, SocialStigmaQA, contains roughly 10K prompts, with a variety of prompt styles, carefully constructed to systematically test for both social bias and model robustness. We present results for SocialStigmaQA with two open source generative language models and we find that the proportion of socially biased output ranges from 45% to 59% across a variety of decoding strategies and prompting styles. We demonstrate that the deliberate design of the templates in our benchmark (e.g., adding biasing text to the prompt or using different verbs that change the answer that indicates bias) impacts the model tendencies to generate socially biased output. Additionally, through manual evaluation, we discover problematic patterns in the generated chain-of-thought output that range from subtle bias to lack of reasoning. Warning: This paper contains examples of text which are toxic, biased, and potentially harmful.
Function Composition in Trustworthy Machine Learning: Implementation Choices, Insights, and Questions
Feb 17, 2023


Ensuring trustworthiness in machine learning (ML) models is a multi-dimensional task. In addition to the traditional notion of predictive performance, other notions such as privacy, fairness, robustness to distribution shift, adversarial robustness, interpretability, explainability, and uncertainty quantification are important considerations to evaluate and improve (if deficient). However, these sub-disciplines or 'pillars' of trustworthiness have largely developed independently, which has limited us from understanding their interactions in real-world ML pipelines. In this paper, focusing specifically on compositions of functions arising from the different pillars, we aim to reduce this gap, develop new insights for trustworthy ML, and answer questions such as the following. Does the composition of multiple fairness interventions result in a fairer model compared to a single intervention? How do bias mitigation algorithms for fairness affect local post-hoc explanations? Does a defense algorithm for untargeted adversarial attacks continue to be effective when composed with a privacy transformation? Toward this end, we report initial empirical results and new insights from 9 different compositions of functions (or pipelines) on 7 real-world datasets along two trustworthy dimensions - fairness and explainability. We also report progress, and implementation choices, on an extensible composer tool to encourage the combination of functionalities from multiple pillars. To-date, the tool supports bias mitigation algorithms for fairness and post-hoc explainability methods. We hope this line of work encourages the thoughtful consideration of multiple pillars when attempting to formulate and resolve a trustworthiness problem.
On the Safety of Interpretable Machine Learning: A Maximum Deviation Approach
Nov 02, 2022


Interpretable and explainable machine learning has seen a recent surge of interest. We focus on safety as a key motivation behind the surge and make the relationship between interpretability and safety more quantitative. Toward assessing safety, we introduce the concept of maximum deviation via an optimization problem to find the largest deviation of a supervised learning model from a reference model regarded as safe. We then show how interpretability facilitates this safety assessment. For models including decision trees, generalized linear and additive models, the maximum deviation can be computed exactly and efficiently. For tree ensembles, which are not regarded as interpretable, discrete optimization techniques can still provide informative bounds. For a broader class of piecewise Lipschitz functions, we leverage the multi-armed bandit literature to show that interpretability produces tighter (regret) bounds on the maximum deviation. We present case studies, including one on mortgage approval, to illustrate our methods and the insights about models that may be obtained from deviation maximization.
Anomaly Attribution with Likelihood Compensation
Aug 23, 2022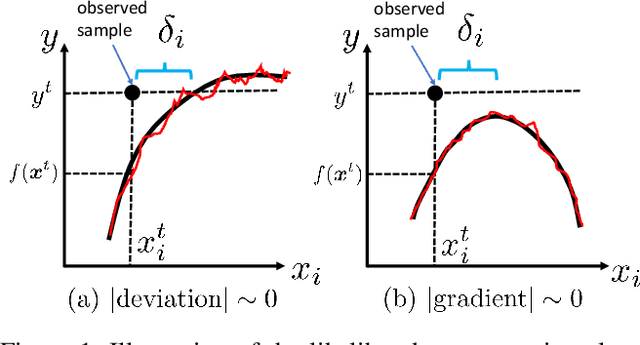
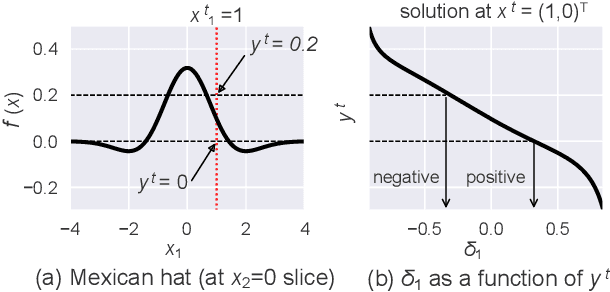
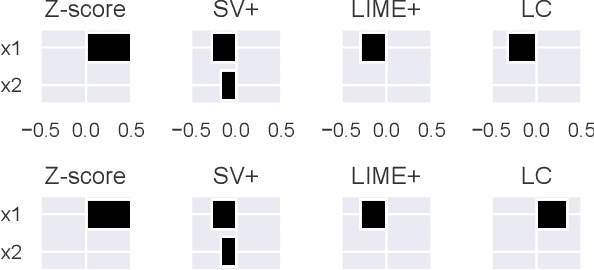
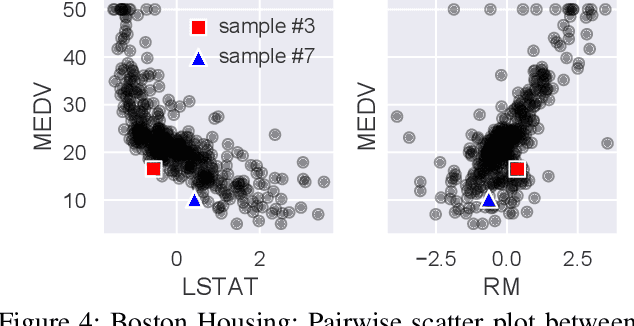
This paper addresses the task of explaining anomalous predictions of a black-box regression model. When using a black-box model, such as one to predict building energy consumption from many sensor measurements, we often have a situation where some observed samples may significantly deviate from their prediction. It may be due to a sub-optimal black-box model, or simply because those samples are outliers. In either case, one would ideally want to compute a ``responsibility score'' indicative of the extent to which an input variable is responsible for the anomalous output. In this work, we formalize this task as a statistical inverse problem: Given model deviation from the expected value, infer the responsibility score of each of the input variables. We propose a new method called likelihood compensation (LC), which is founded on the likelihood principle and computes a correction to each input variable. To the best of our knowledge, this is the first principled framework that computes a responsibility score for real valued anomalous model deviations. We apply our approach to a real-world building energy prediction task and confirm its utility based on expert feedback.
Write It Like You See It: Detectable Differences in Clinical Notes By Race Lead To Differential Model Recommendations
May 08, 2022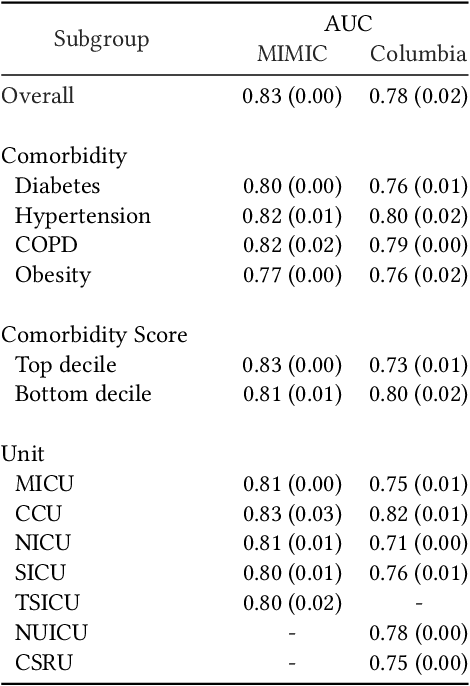
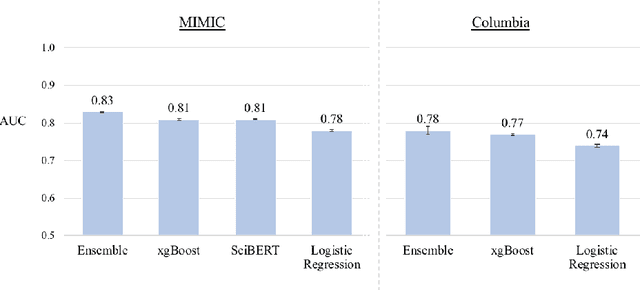


Clinical notes are becoming an increasingly important data source for machine learning (ML) applications in healthcare. Prior research has shown that deploying ML models can perpetuate existing biases against racial minorities, as bias can be implicitly embedded in data. In this study, we investigate the level of implicit race information available to ML models and human experts and the implications of model-detectable differences in clinical notes. Our work makes three key contributions. First, we find that models can identify patient self-reported race from clinical notes even when the notes are stripped of explicit indicators of race. Second, we determine that human experts are not able to accurately predict patient race from the same redacted clinical notes. Finally, we demonstrate the potential harm of this implicit information in a simulation study, and show that models trained on these race-redacted clinical notes can still perpetuate existing biases in clinical treatment decisions.
Ground-Truth, Whose Truth? -- Examining the Challenges with Annotating Toxic Text Datasets
Dec 07, 2021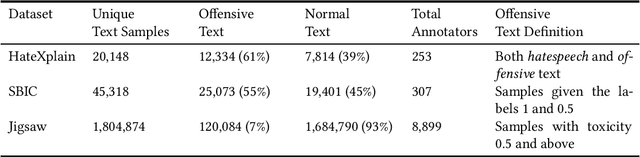
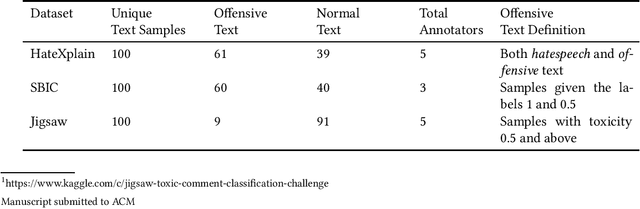
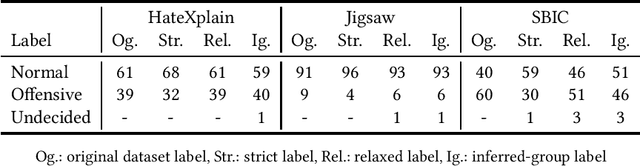
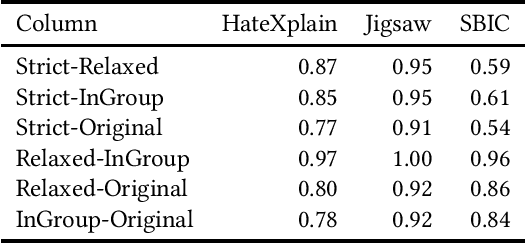
The use of machine learning (ML)-based language models (LMs) to monitor content online is on the rise. For toxic text identification, task-specific fine-tuning of these models are performed using datasets labeled by annotators who provide ground-truth labels in an effort to distinguish between offensive and normal content. These projects have led to the development, improvement, and expansion of large datasets over time, and have contributed immensely to research on natural language. Despite the achievements, existing evidence suggests that ML models built on these datasets do not always result in desirable outcomes. Therefore, using a design science research (DSR) approach, this study examines selected toxic text datasets with the goal of shedding light on some of the inherent issues and contributing to discussions on navigating these challenges for existing and future projects. To achieve the goal of the study, we re-annotate samples from three toxic text datasets and find that a multi-label approach to annotating toxic text samples can help to improve dataset quality. While this approach may not improve the traditional metric of inter-annotator agreement, it may better capture dependence on context and diversity in annotators. We discuss the implications of these results for both theory and practice.