 Add to Chrome
 Add to Firefox
 Add to Edge
Topological Analysis for Detecting Anomalies (TADA) in Time Series
Jun 10, 2024


This paper introduces new methodology based on the field of Topological Data Analysis for detecting anomalies in multivariate time series, that aims to detect global changes in the dependency structure between channels. The proposed approach is lean enough to handle large scale datasets, and extensive numerical experiments back the intuition that it is more suitable for detecting global changes of correlation structures than existing methods. Some theoretical guarantees for quantization algorithms based on dependent time sequences are also provided.
ATOL: Automatic Topologically-Oriented Learning
Sep 30, 2019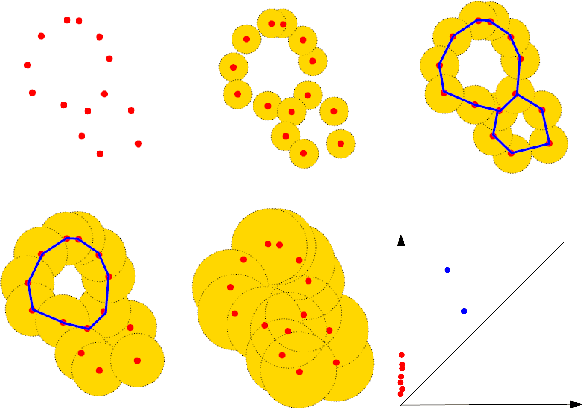
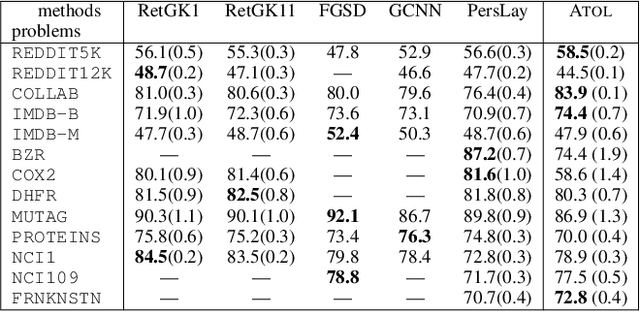
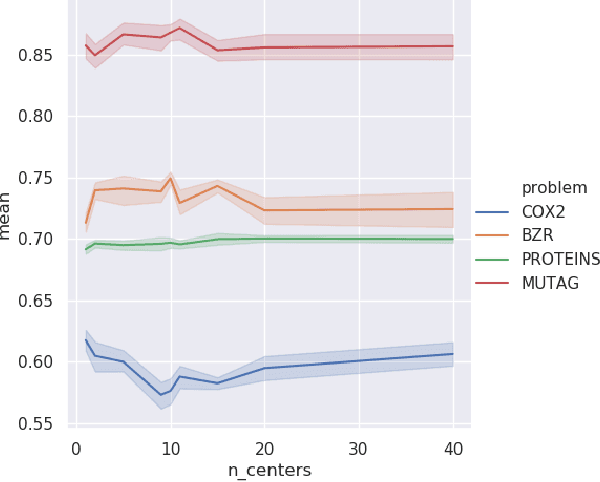
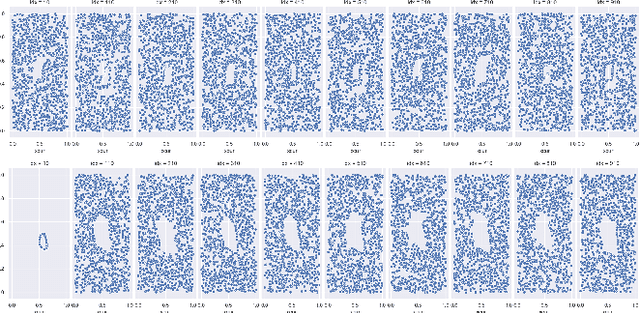
There are abundant cases for using Topological Data Analysis (TDA) in a learning context, but robust topological information commonly comes in the form of a set of persistence diagrams, objects that by nature are uneasy to affix to a generic machine learning framework. We introduce a vectorisation method for diagrams that allows to collect information from topological descriptors into a format fit for machine learning tools. Based on a few observations, the method is learned and tailored to discriminate the various important plane regions a diagram is set into. With this tool one can automatically augment any sort of machine learning problem with access to a TDA method, enhance performances, construct features reflecting underlying changes in topological behaviour. The proposed methodology comes with only high level tuning parameters such as the encoding budget for topological features. We provide an open-access, ready-to-use implementation and notebook. We showcase the strengths and versatility of our approach on a number of applications. From emulous and modern graph collections to a highly topological synthetic dynamical orbits data, we prove that the method matches or beats the state-of-the-art in encoding persistence diagrams to solve hard problems. We then apply our method in the context of an industrial, difficult time-series regression problem and show the approach to be relevant.
PersLay: A Simple and Versatile Neural Network Layer for Persistence Diagrams
Jun 05, 2019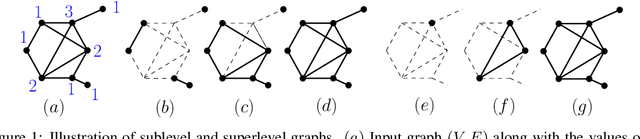
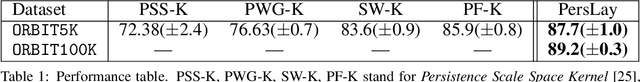
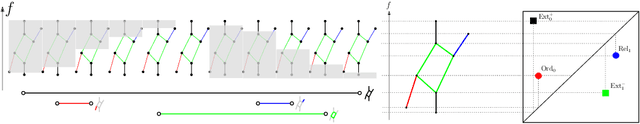
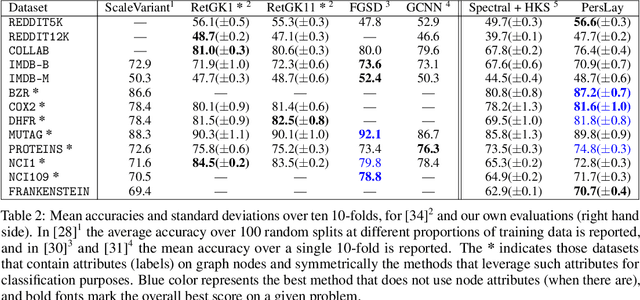
Persistence diagrams, a key descriptor from Topological Data Analysis, encode and summarize all sorts of topological features and have already proved pivotal in many different applications of data science. But persistence diagrams are weakly structured and therefore constitute a difficult input for most Machine Learning techniques. To address this concern several vectorization methods have been put forward that embed persistence diagrams into either finite-dimensional Euclidean spaces or implicit Hilbert spaces with kernels. But finite-dimensional embeddings are prone to miss a lot of information about persistence diagrams, while kernel methods require the full computation of the kernel matrix. We introduce PersLay: a simple, highly modular layer of learning architecture for persistence diagrams that allows to exploit the full capacities of neural networks on topological information from any dataset. This layer encompasses most of the vectorization methods of the literature. We illustrate its strengths on challenging classification problems on dynamical systems orbit or real-life graph data, with results improving or comparable to the state-of-the-art. In order to exploit topological information from graph data, we show how graph structures can be encoded in the so-called extended persistence diagrams computed with the heat kernel signatures of the graphs.
Model Assisted Variable Clustering: Minimax-optimal Recovery and Algorithms
Apr 16, 2018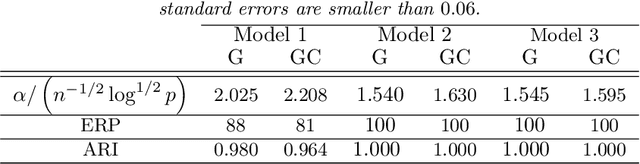
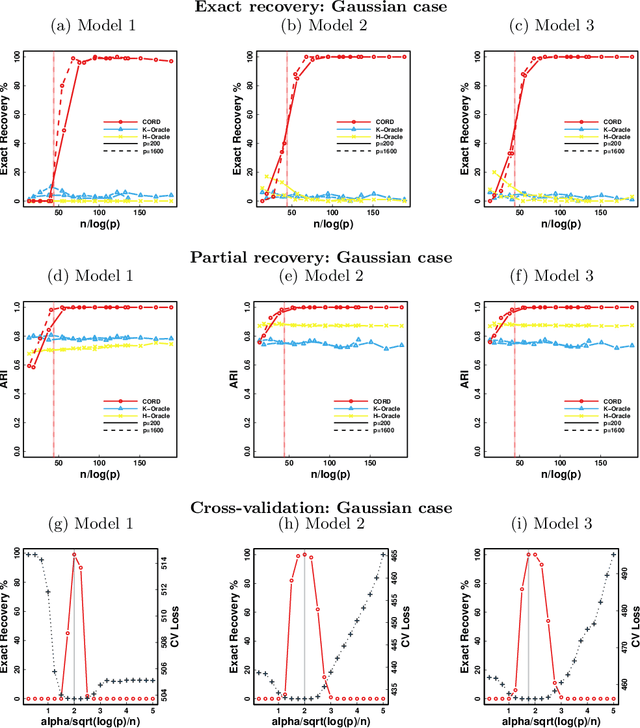
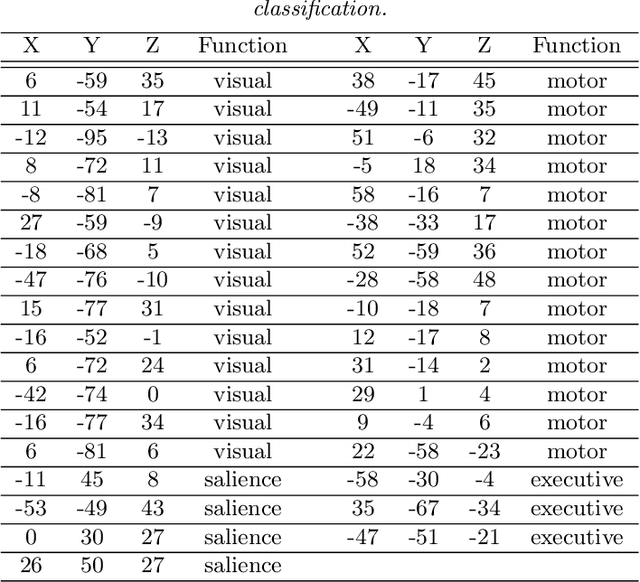
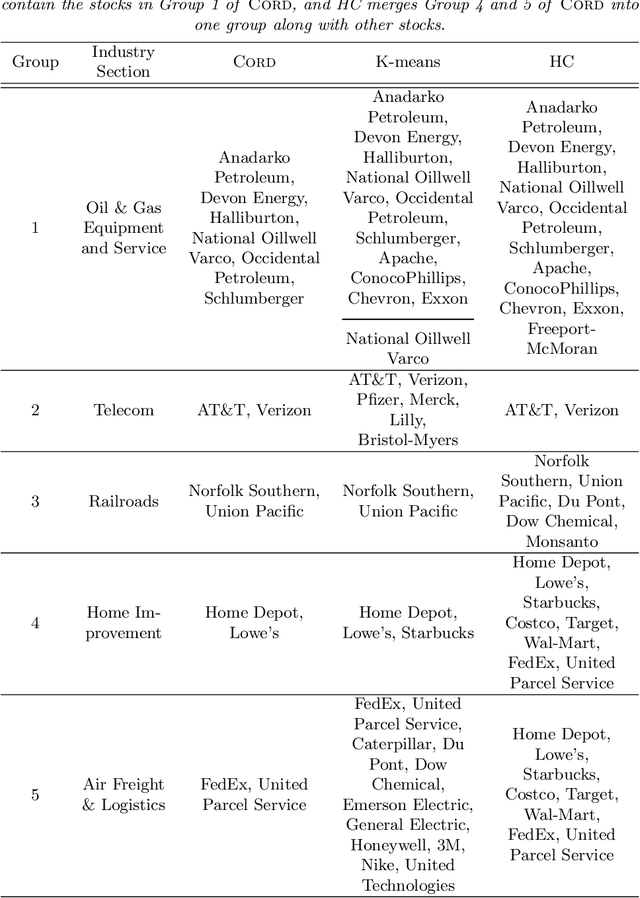
Model-based clustering defines population level clusters relative to a model that embeds notions of similarity. Algorithms tailored to such models yield estimated clusters with a clear statistical interpretation. We take this view here and introduce the class of $G$-block covariance models as a background model for variable clustering. In such models, two variables in a cluster are deemed similar if they have similar associations will all other variables. This can arise, for instance, when groups of variables are noise corrupted versions of the same latent factor. We quantify the difficulty of clustering data generated from a $G$-block covariance model in terms of cluster proximity, measured with respect to two related, but different, cluster separation metrics. We derive minimax cluster separation thresholds, which are the metric values below which no algorithm can recover the model-defined clusters exactly, and show that they are different for the two metrics. We therefore develop two algorithms, COD and PECOK, tailored to G-block covariance models, and study their minimax-optimality with respect to each metric. Of independent interest is the fact that the analysis of the PECOK algorithm, which is based on a corrected convex relaxation of the popular $K$-means algorithm, provides the first statistical analysis of such algorithms for variable clustering. Additionally, we contrast our methods with another popular clustering method, spectral clustering, specialized to variable clustering, and show that ensuring exact cluster recovery via this method requires clusters to have a higher separation, relative to the minimax threshold. Extensive simulation studies, as well as our data analyses, confirm the applicability of our approach.