 Add to Chrome
 Add to Firefox
 Add to Edge
Visual Fingerprints for LLM Generation Comparison
May 07, 2026Large language model (LLM) outputs arise from complex interactions among prompts, system instructions, model parameters, and architecture. We refer to specific configurations of these factors as generation conditions, each of which can bias outputs in various ways. Understanding how different generation conditions shape model behaviors is essential for tasks such as prompt design and model evaluation, yet it remains challenging due to the stochastic and open-ended nature of text generation. We present an approach to visually compare LLM outputs across generation conditions by modeling responses as collections of linguistic choices, including content, expression, and structure. We extract these choices using natural language processing pipelines and represent their distributions across repeated samples. We then visualize these distributions as visual fingerprints, enabling direct, distribution-level comparison of condition-specific tendencies. Through four usage scenarios, we demonstrate how visual fingerprints reveal consistent patterns in LLM behavior that are difficult to observe through individual responses or aggregate metrics.
GFlowState: Visualizing the Training of Generative Flow Networks Beyond the Reward
Apr 23, 2026We present GFlowState, a visual analytics system designed to illuminate the training process of Generative Flow Networks (GFlowNets or GFNs). GFlowNets are a probabilistic framework for generating samples proportionally to a reward function. While GFlowNets have proved to be powerful tools in applications such as molecule and material discovery, their training dynamics remain difficult to interpret. Standard machine learning tools allow metric tracking but do not reveal how models explore the sample space, construct sample trajectories, or shift sampling probabilities during training. Our solution, GFlowState, allows users to analyze sampling trajectories, compare the sample space relative to reference datasets, and analyze the training dynamics. To this end, we introduce multiple views, including a chart of candidate rankings, a state projection, a node-link diagram of the trajectory network, and a transition heatmap. These visualizations enable GFlowNet developers and users to investigate sampling behavior and policy evolution, and to identify underexplored regions and sources of training failure. Case studies demonstrate how the system supports debugging and assessing the quality of GFlowNets across application domains. By making the structural dynamics of GFlowNets observable, our work enhances their interpretability and can accelerate GFlowNet development in practice.
ParaDime: A Framework for Parametric Dimensionality Reduction
Oct 10, 2022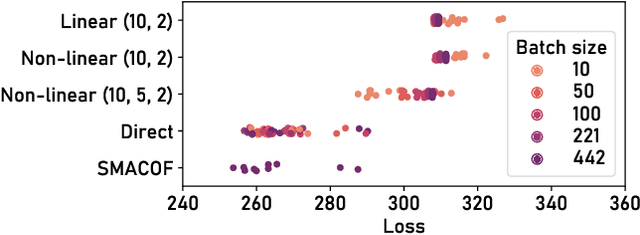
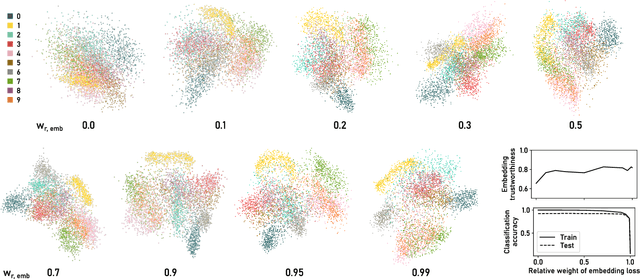
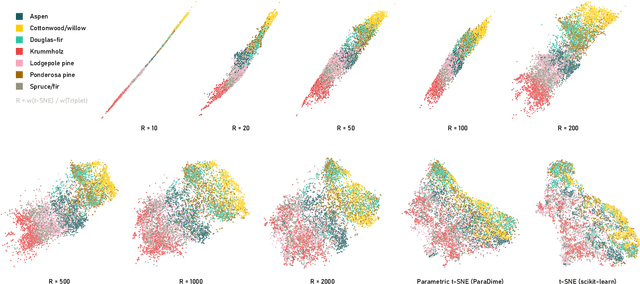
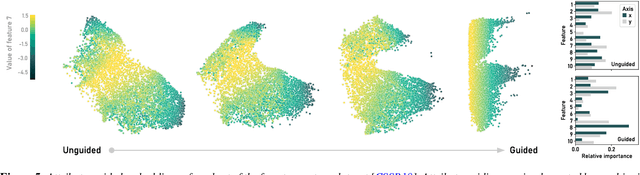
ParaDime is a framework for parametric dimensionality reduction (DR). In parametric DR, neural networks are trained to embed high-dimensional data items in a low-dimensional space while minimizing an objective function. ParaDime builds on the idea that the objective functions of several modern DR techniques result from transformed inter-item relationships. It provides a common interface to specify the way these relations and transformations are computed and how they are used within the losses that govern the training process. Through this interface, ParaDime unifies parametric versions of DR techniques such as metric MDS, t-SNE, and UMAP. Furthermore, it allows users to fully customize each aspect of the DR process. We show how this ease of customization makes ParaDime suitable for experimenting with interesting techniques, such as hybrid classification/embedding models or supervised DR, which opens up new possibilities for visualizing high-dimensional data.
InstanceFlow: Visualizing the Evolution of Classifier Confusion on the Instance Level
Aug 25, 2020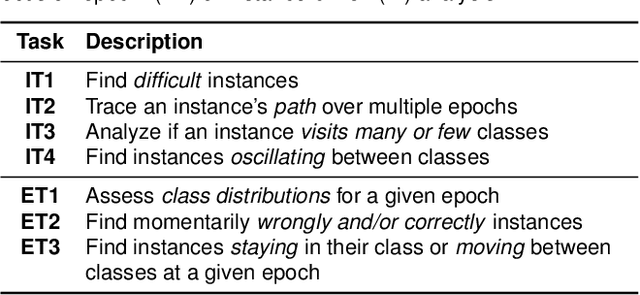
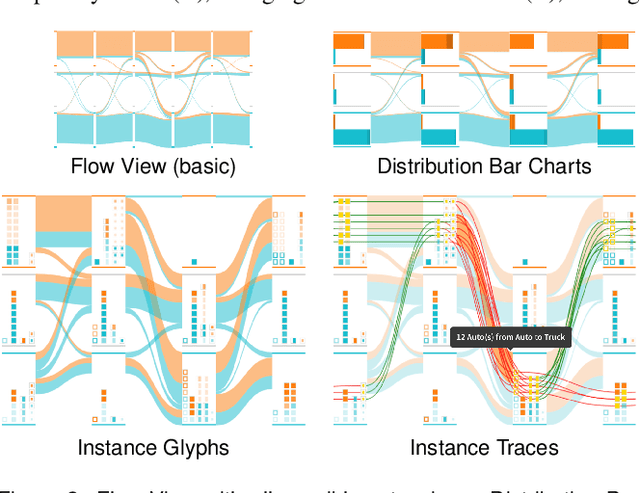
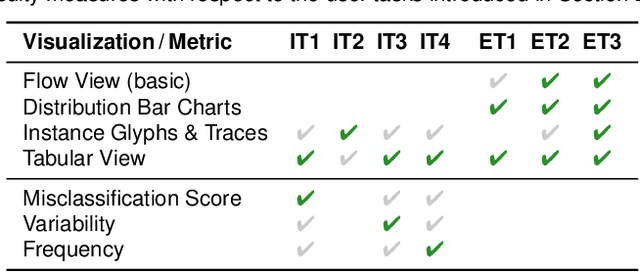
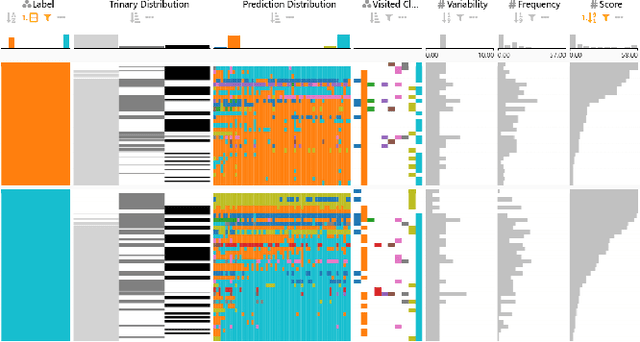
Classification is one of the most important supervised machine learning tasks. During the training of a classification model, the training instances are fed to the model multiple times (during multiple epochs) in order to iteratively increase the classification performance. The increasing complexity of models has led to a growing demand for model interpretability through visualizations. Existing approaches mostly focus on the visual analysis of the final model performance after training and are often limited to aggregate performance measures. In this paper we introduce InstanceFlow, a novel dual-view visualization tool that allows users to analyze the learning behavior of classifiers over time on the instance-level. A Sankey diagram visualizes the flow of instances throughout epochs, with on-demand detailed glyphs and traces for individual instances. A tabular view allows users to locate interesting instances by ranking and filtering. In this way, InstanceFlow bridges the gap between class-level and instance-level performance evaluation while enabling users to perform a full temporal analysis of the training process.
Projective Latent Space Decluttering
Jun 23, 2020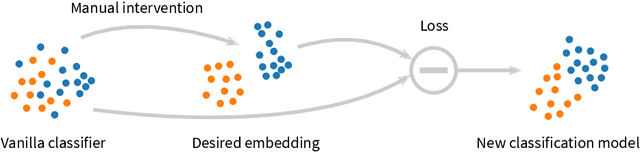
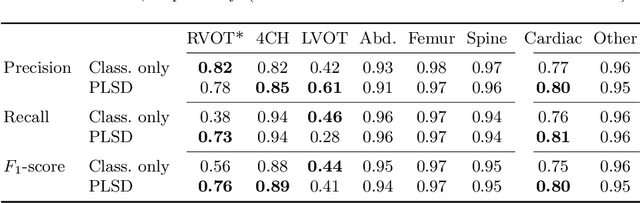
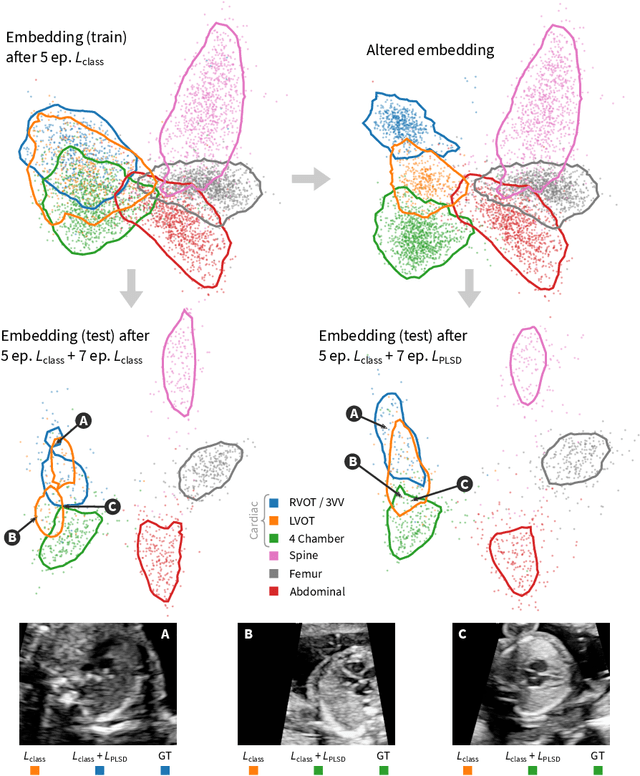
High-dimensional latent representations learned by neural network classifiers are notoriously hard to interpret. Especially in medical applications, model developers and domain experts desire a better understanding of how these latent representations relate to the resulting classification performance. We present a framework for retraining classifiers by backpropagating manual changes made to low-dimensional embeddings of the latent space. This means that our technique allows the practitioner to control the latent decision space in an intuitive way. Our approach is based on parametric approximations of non-linear embedding techniques such as t-distributed stochastic neighbourhood embedding. Using this approach, it is possible to manually shape and declutter the latent space of image classifiers in order to better match the expectations of domain experts or to fulfil specific requirements of classification tasks. For instance, the performance for specific class pairs can be enhanced by manually separating the class clusters in the embedding, without significantly affecting the overall performance of the other classes. We evaluate our technique on a real-world scenario in fetal ultrasound imaging.
Exploring Visual Patterns in Projected Human and Machine Decision-Making Paths
Jan 20, 2020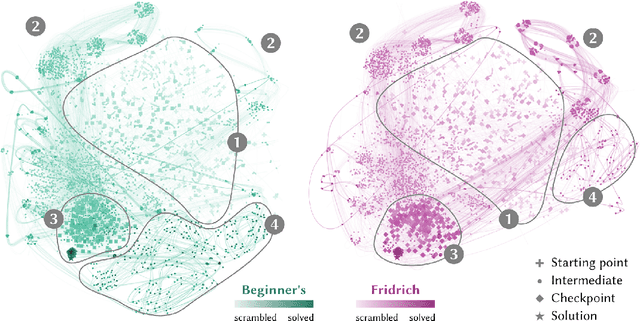
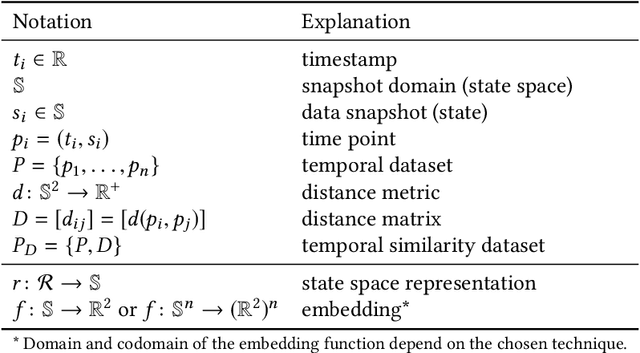
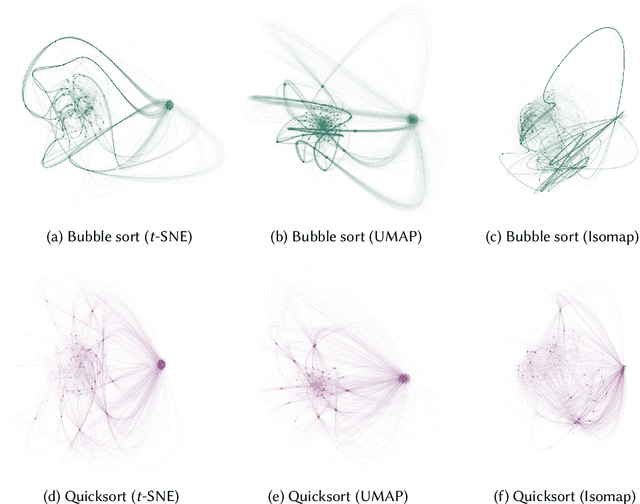
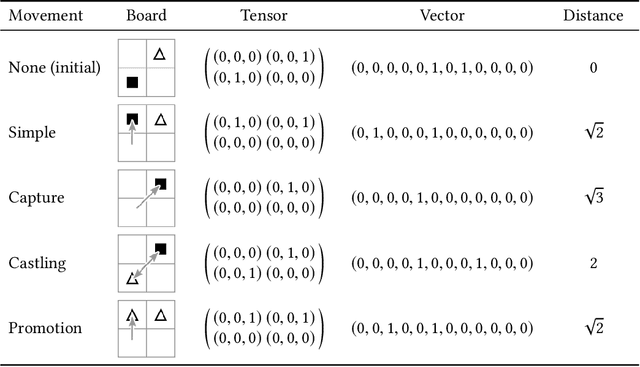
In problem solving, the paths towards solutions can be viewed as a sequence of decisions. The decisions, made by humans or computers, describe a trajectory through a high-dimensional representation space of the problem. Using dimensionality reduction, these trajectories can be visualized in lower dimensional space. Such embedded trajectories have previously been applied to a wide variety of data, but so far, almost exclusively the self-similarity of single trajectories has been analyzed. In contrast, we describe patterns emerging from drawing many trajectories---for different initial conditions, end states, or solution strategies---in the same embedding space. We argue that general statements about the problem solving tasks and solving strategies can be made by interpreting these patterns. We explore and characterize such patterns in trajectories resulting from human and machine-made decisions in a variety of application domains: logic puzzles (Rubik's cube), strategy games (chess), and optimization problems (neural network training). In the context of Rubik's cube, we present a physical interactive demonstrator that uses trajectory visualization to provide immediate feedback to users regarding the consequences of their decisions. We also discuss the importance of suitably chosen representation spaces and similarity metrics for the embedding.
ConfusionFlow: A model-agnostic visualization for temporal analysis of classifier confusion
Oct 02, 2019
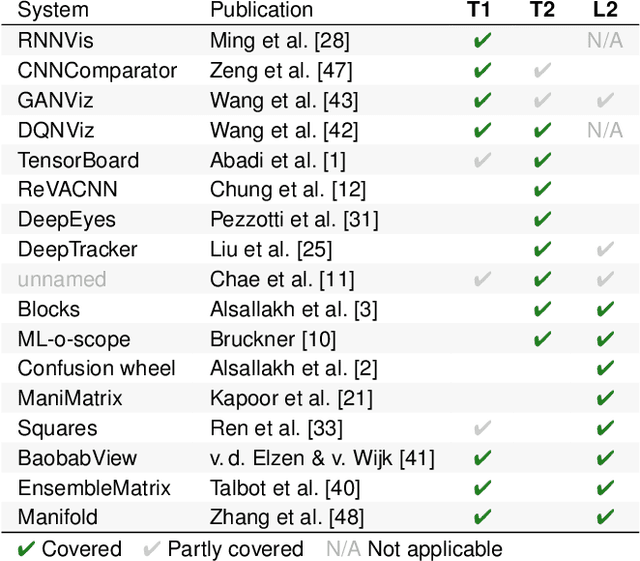
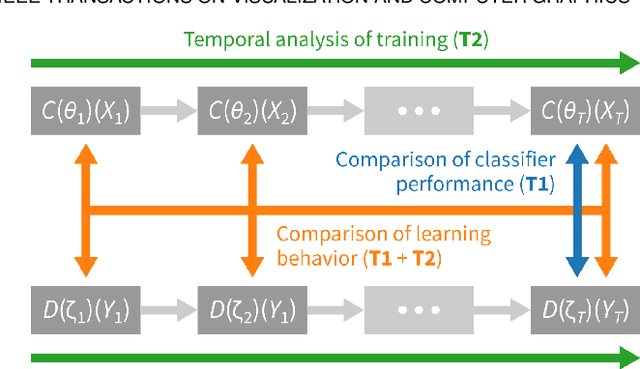
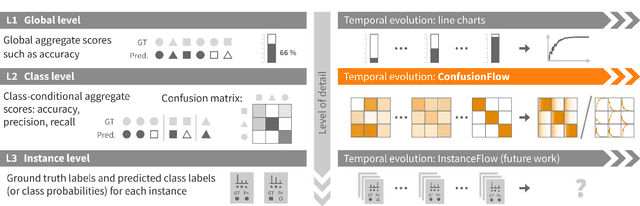
Classifiers are among the most widely used supervised machine learning algorithms. Many classification models exist, and choosing the right one for a given task is difficult. During model selection and debugging, data scientists need to asses classifier performance, evaluate the training behavior over time, and compare different models. Typically, this analysis is based on single-number performance measures such as accuracy. A more detailed evaluation of classifiers is possible by inspecting class errors. The confusion matrix is an established way for visualizing these class errors, but it was not designed with temporal or comparative analysis in mind. More generally, established performance analysis systems do not allow a combined temporal and comparative analysis of class-level information. To address this issue, we propose ConfusionFlow, an interactive, comparative visualization tool that combines the benefits of class confusion matrices with the visualization of performance characteristics over time. ConfusionFlow is model-agnostic and can be used to compare performances for different model types, model architectures, and/or training and test datasets. We demonstrate the usefulness of ConfusionFlow in the context of two practical problems: an analysis of the influence of network pruning on model errors, and a case study on instance selection strategies in active learning.