 Add to Chrome
 Add to Firefox
 Add to Edge
Predicting optical coherence tomography-derived diabetic macular edema grades from fundus photographs using deep learning
Oct 18, 2018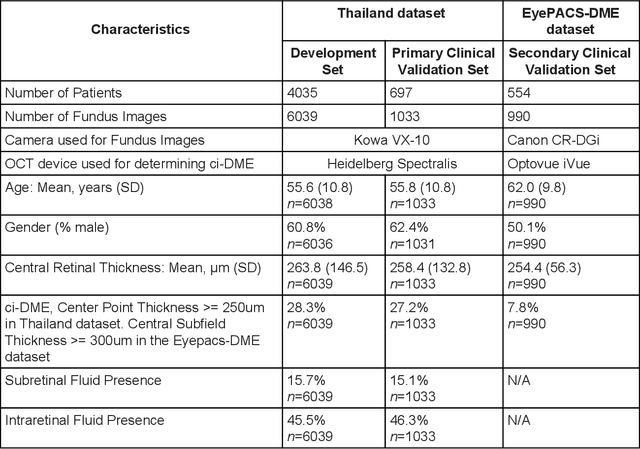
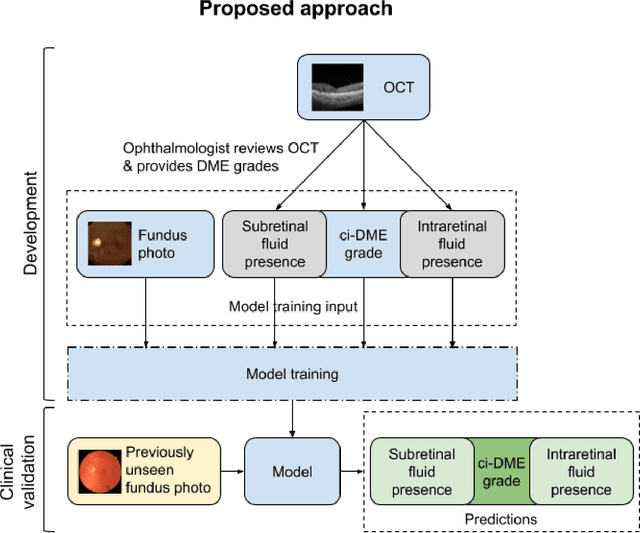
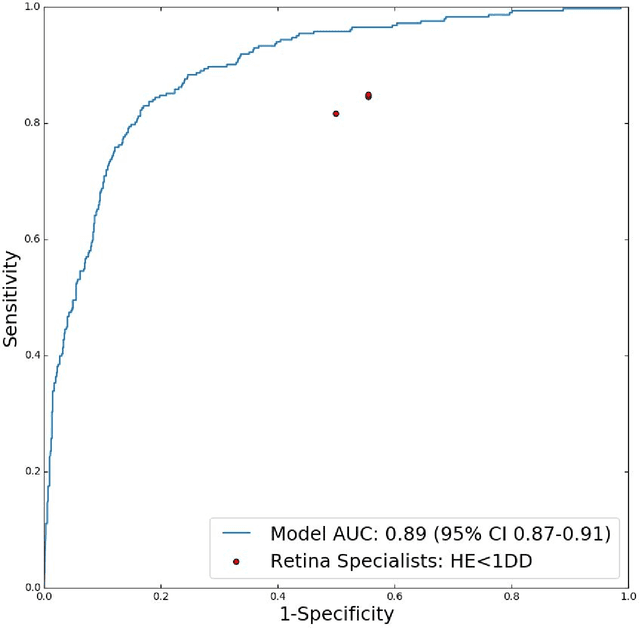
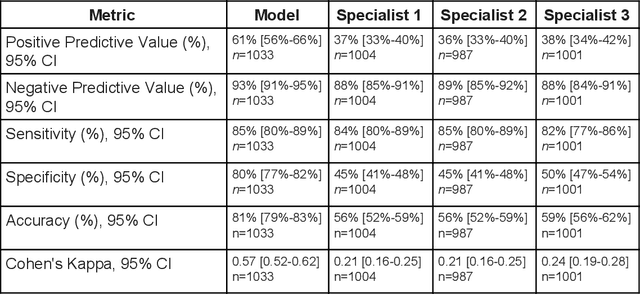
Diabetic eye disease is one of the fastest growing causes of preventable blindness. With the advent of anti-VEGF (vascular endothelial growth factor) therapies, it has become increasingly important to detect center-involved diabetic macular edema. However, center-involved diabetic macular edema is diagnosed using optical coherence tomography (OCT), which is not generally available at screening sites because of cost and workflow constraints. Instead, screening programs rely on the detection of hard exudates as a proxy for DME on color fundus photographs, often resulting in high false positive or false negative calls. To improve the accuracy of DME screening, we trained a deep learning model to use color fundus photographs to predict DME grades derived from OCT exams. Our "OCT-DME" model had an AUC of 0.89 (95% CI: 0.87-0.91), which corresponds to a sensitivity of 85% at a specificity of 80%. In comparison, three retinal specialists had similar sensitivities (82-85%), but only half the specificity (45-50%, p<0.001 for each comparison with model). The positive predictive value (PPV) of the OCT-DME model was 61% (95% CI: 56-66%), approximately double the 36-38% by the retina specialists. In addition, we used saliency and other techniques to examine how the model is making its prediction. The ability of deep learning algorithms to make clinically relevant predictions that generally require sophisticated 3D-imaging equipment from simple 2D images has broad relevance to many other applications in medical imaging.
Deep Learning vs. Human Graders for Classifying Severity Levels of Diabetic Retinopathy in a Real-World Nationwide Screening Program
Oct 18, 2018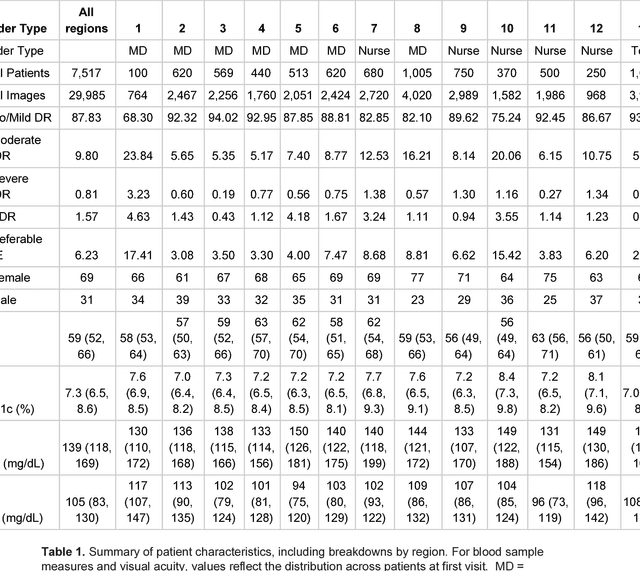
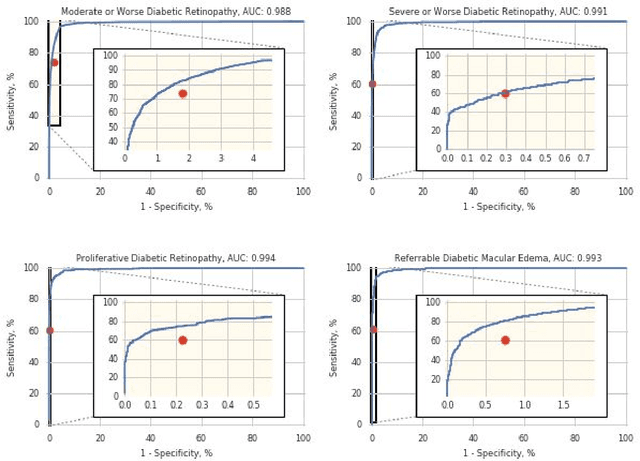
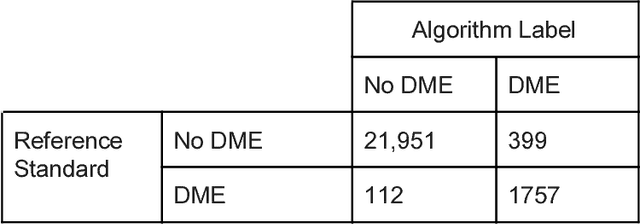
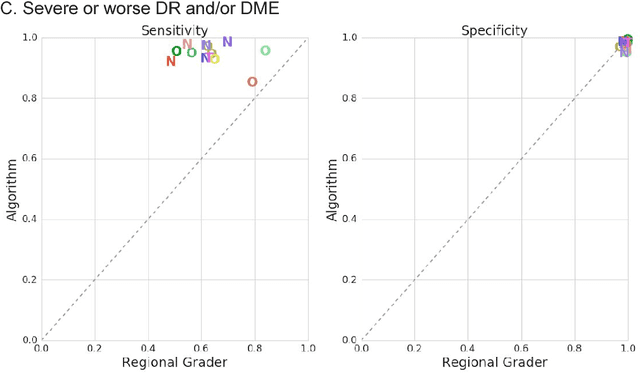
Deep learning algorithms have been used to detect diabetic retinopathy (DR) with specialist-level accuracy. This study aims to validate one such algorithm on a large-scale clinical population, and compare the algorithm performance with that of human graders. 25,326 gradable retinal images of patients with diabetes from the community-based, nation-wide screening program of DR in Thailand were analyzed for DR severity and referable diabetic macular edema (DME). Grades adjudicated by a panel of international retinal specialists served as the reference standard. Across different severity levels of DR for determining referable disease, deep learning significantly reduced the false negative rate (by 23%) at the cost of slightly higher false positive rates (2%). Deep learning algorithms may serve as a valuable tool for DR screening.