 Add to Chrome
 Add to Firefox
 Add to Edge
Radon--Wasserstein Gradient Flows for Interacting-Particle Sampling in High Dimensions
Feb 05, 2026Gradient flows of the Kullback--Leibler (KL) divergence, such as the Fokker--Planck equation and Stein Variational Gradient Descent, evolve a distribution toward a target density known only up to a normalizing constant. We introduce new gradient flows of the KL divergence with a remarkable combination of properties: they admit accurate interacting-particle approximations in high dimensions, and the per-step cost scales linearly in both the number of particles and the dimension. These gradient flows are based on new transportation-based Riemannian geometries on the space of probability measures: the Radon--Wasserstein geometry and the related Regularized Radon--Wasserstein (RRW) geometry. We define these geometries using the Radon transform so that the gradient-flow velocities depend only on one-dimensional projections. This yields interacting-particle-based algorithms whose per-step cost follows from efficient Fast Fourier Transform-based evaluation of the required 1D convolutions. We additionally provide numerical experiments that study the performance of the proposed algorithms and compare convergence behavior and quantization. Finally, we prove some theoretical results including well-posedness of the flows and long-time convergence guarantees for the RRW flow.
Birth-death dynamics for sampling: Global convergence, approximations and their asymptotics
Nov 01, 2022Motivated by the challenge of sampling Gibbs measures with nonconvex potentials, we study a continuum birth-death dynamics. We prove that the probability density of the birth-death governed by Kullback-Leibler divergence or by $\chi^2$ divergence converge exponentially fast to the Gibbs equilibrium measure with a universal rate that is independent of the potential barrier. To build a practical numerical sampler based on the pure birth-death dynamics, we consider an interacting particle system which relies on kernel-based approximations of the measure and retains the gradient-flow structure. We show on the torus that the kernelized dynamics $\Gamma$-converges, on finite time intervals, to the pure birth-death dynamics as the kernel bandwidth shrinks to zero. Moreover we provide quantitative estimates on the bias of minimizers of the energy corresponding to the kernalized dynamics. Finally we prove the long-time asymptotic results on the convergence of the asymptotic states of the kernalized dynamics towards the Gibbs measure.
Boundary Estimation from Point Clouds: Algorithms, Guarantees and Applications
Nov 05, 2021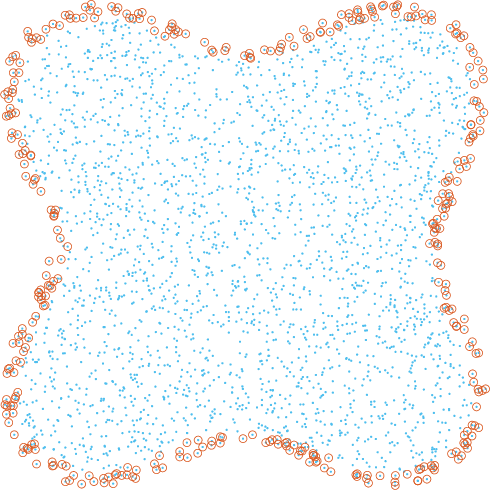
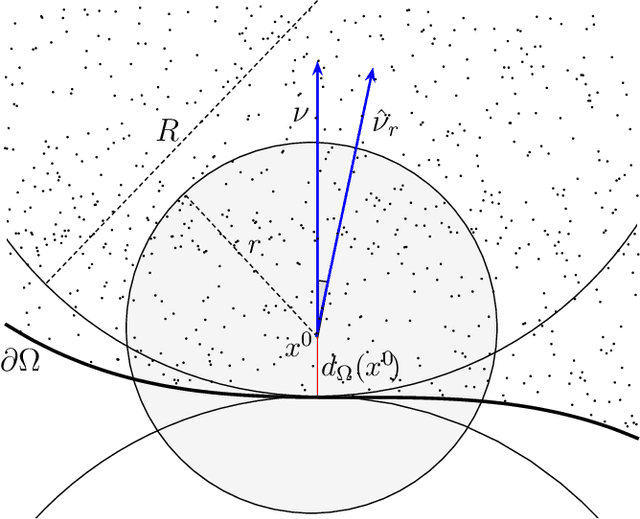
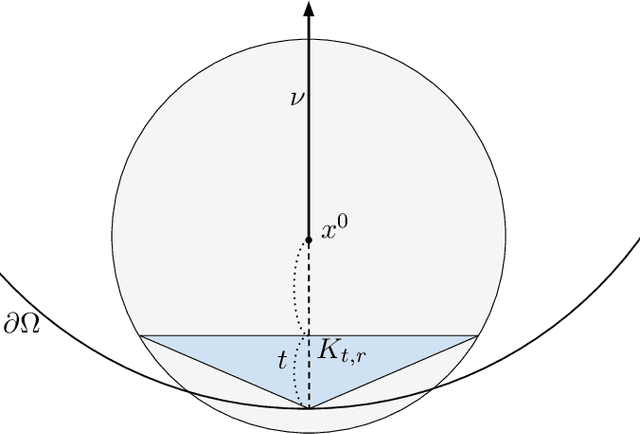
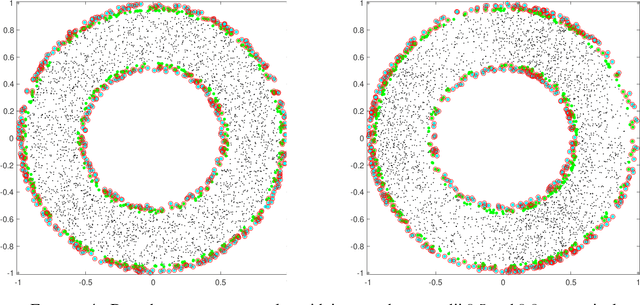
We investigate identifying the boundary of a domain from sample points in the domain. We introduce new estimators for the normal vector to the boundary, distance of a point to the boundary, and a test for whether a point lies within a boundary strip. The estimators can be efficiently computed and are more accurate than the ones present in the literature. We provide rigorous error estimates for the estimators. Furthermore we use the detected boundary points to solve boundary-value problems for PDE on point clouds. We prove error estimates for the Laplace and eikonal equations on point clouds. Finally we provide a range of numerical experiments illustrating the performance of our boundary estimators, applications to PDE on point clouds, and tests on image data sets.
Clustering dynamics on graphs: from spectral clustering to mean shift through Fokker-Planck interpolation
Aug 18, 2021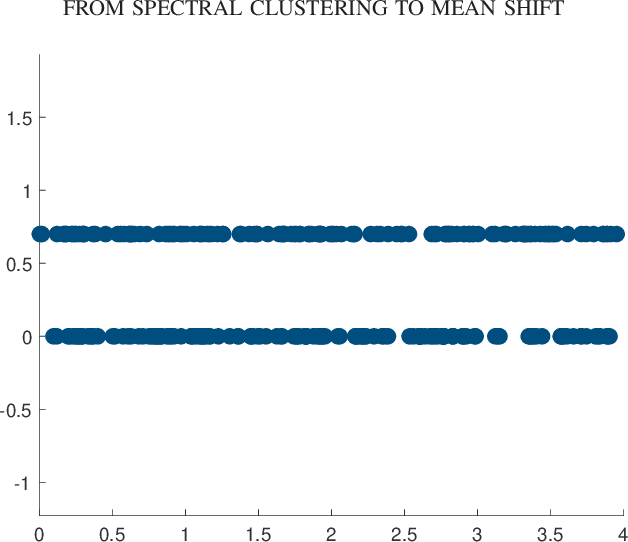
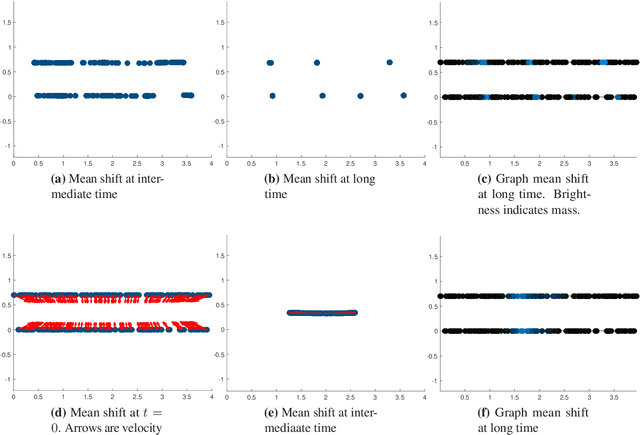
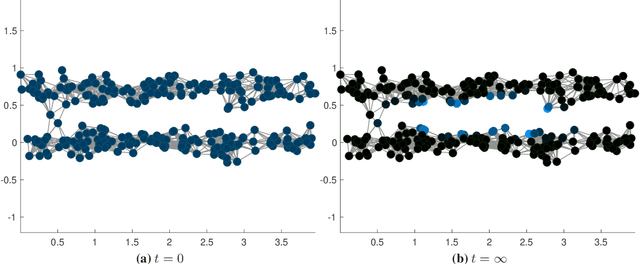
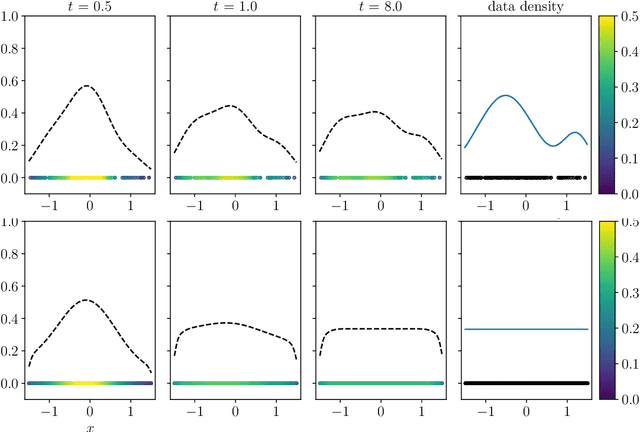
In this work we build a unifying framework to interpolate between density-driven and geometry-based algorithms for data clustering, and specifically, to connect the mean shift algorithm with spectral clustering at discrete and continuum levels. We seek this connection through the introduction of Fokker-Planck equations on data graphs. Besides introducing new forms of mean shift algorithms on graphs, we provide new theoretical insights on the behavior of the family of diffusion maps in the large sample limit as well as provide new connections between diffusion maps and mean shift dynamics on a fixed graph. Several numerical examples illustrate our theoretical findings and highlight the benefits of interpolating density-driven and geometry-based clustering algorithms.
Rates of Convergence for Laplacian Semi-Supervised Learning with Low Labeling Rates
Jun 04, 2020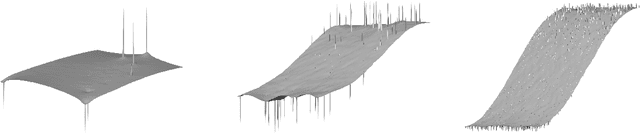
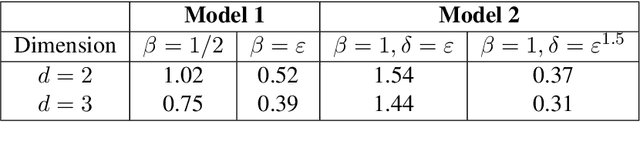
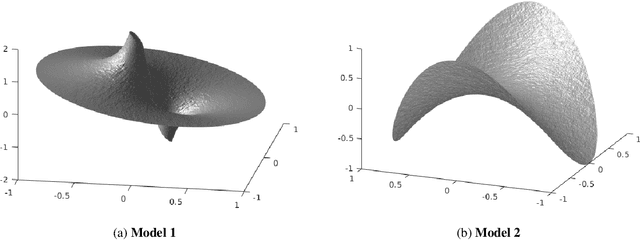
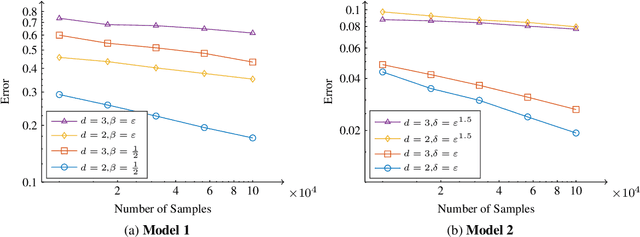
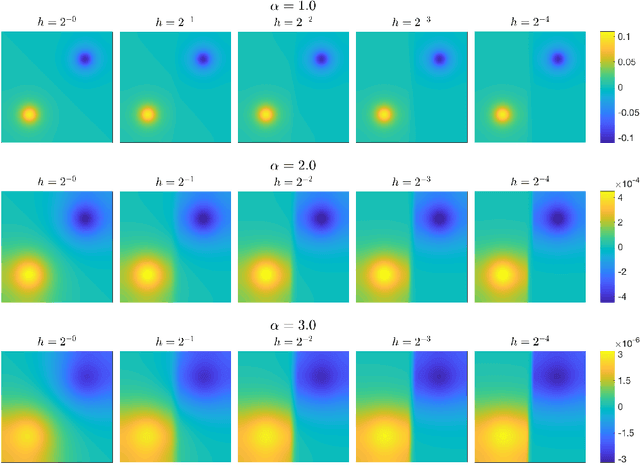
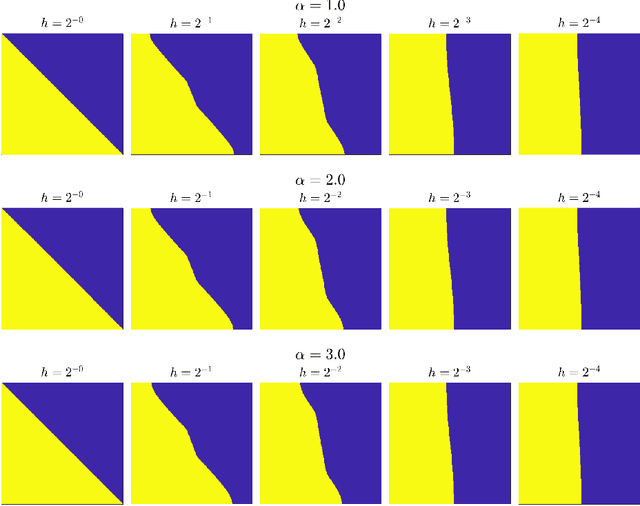
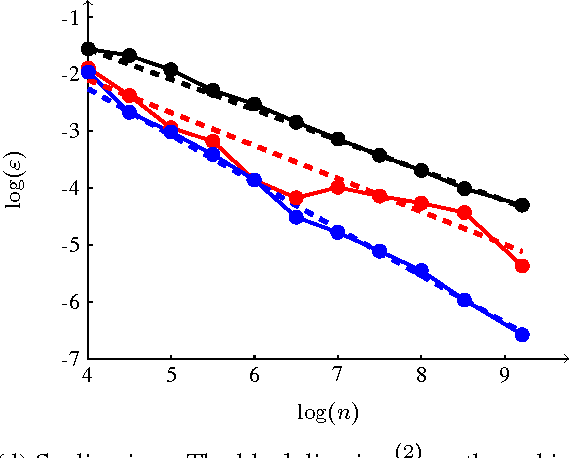
We study graph-based Laplacian semi-supervised learning at low labeling rates. Laplacian learning uses harmonic extension on a graph to propagate labels. At very low label rates, Laplacian learning becomes degenerate and the solution is roughly constant with spikes at each labeled data point. Previous work has shown that this degeneracy occurs when the number of labeled data points is finite while the number of unlabeled data points tends to infinity. In this work we allow the number of labeled data points to grow to infinity with the number of labels. Our results show that for a random geometric graph with length scale $\varepsilon>0$ and labeling rate $\beta>0$, if $\beta \ll\varepsilon^2$ then the solution becomes degenerate and spikes form, and if $\beta\gg \varepsilon^2$ then Laplacian learning is well-posed and consistent with a continuum Laplace equation. Furthermore, in the well-posed setting we prove quantitative error estimates of $O(\varepsilon\beta^{-1/2})$ for the difference between the solutions of the discrete problem and continuum PDE, up to logarithmic factors. We also study $p$-Laplacian regularization and show the same degeneracy result when $\beta \ll \varepsilon^p$. The proofs of our well-posedness results use the random walk interpretation of Laplacian learning and PDE arguments, while the proofs of the ill-posedness results use $\Gamma$-convergence tools from the calculus of variations. We also present numerical results on synthetic and real data to illustrate our results.
Mumford-Shah functionals on graphs and their asymptotics
Jun 22, 2019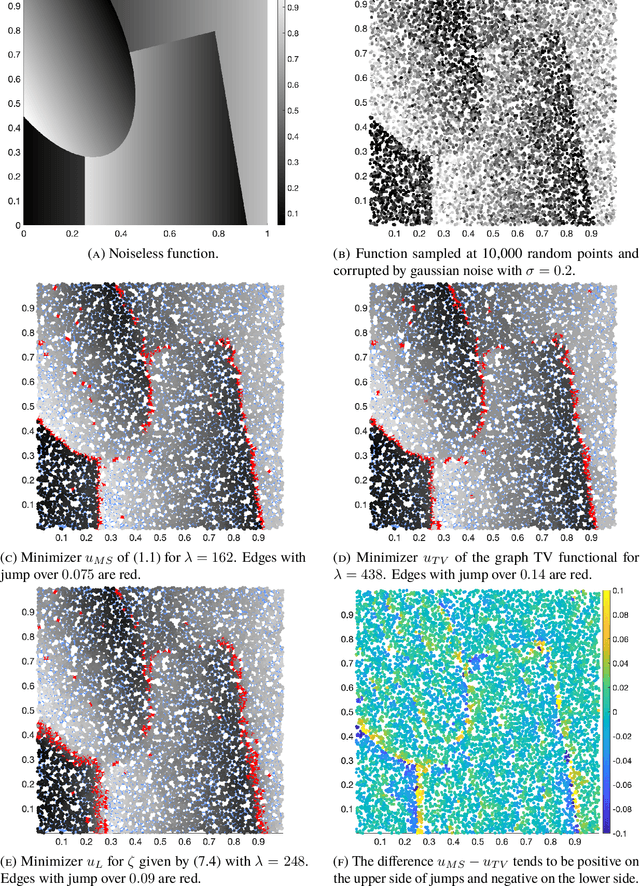
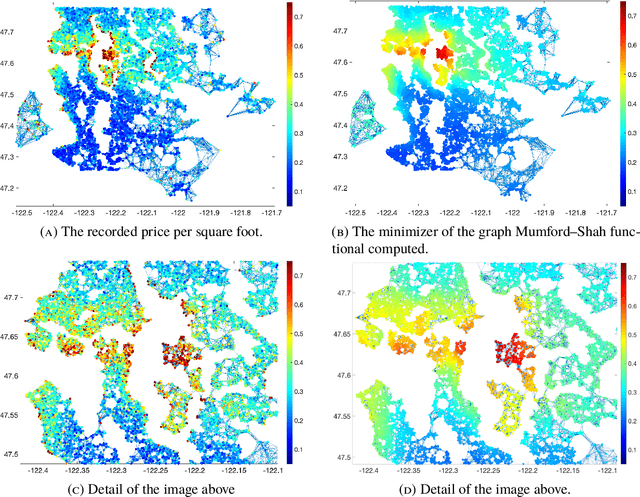
We consider adaptations of the Mumford-Shah functional to graphs. These are based on discretizations of nonlocal approximations to the Mumford-Shah functional. Motivated by applications in machine learning we study the random geometric graphs associated to random samples of a measure. We establish the conditions on the graph constructions under which the minimizers of graph Mumford-Shah functionals converge to a minimizer of a continuum Mumford-Shah functional. Furthermore we explicitly identify the limiting functional. Moreover we describe an efficient algorithm for computing the approximate minimizers of the graph Mumford-Shah functional.
Large Data and Zero Noise Limits of Graph-Based Semi-Supervised Learning Algorithms
May 23, 2018
Scalings in which the graph Laplacian approaches a differential operator in the large graph limit are used to develop understanding of a number of algorithms for semi-supervised learning; in particular the extension, to this graph setting, of the probit algorithm, level set and kriging methods, are studied. Both optimization and Bayesian approaches are considered, based around a regularizing quadratic form found from an affine transformation of the Laplacian, raised to a, possibly fractional, exponent. Conditions on the parameters defining this quadratic form are identified under which well-defined limiting continuum analogues of the optimization and Bayesian semi-supervised learning problems may be found, thereby shedding light on the design of algorithms in the large graph setting. The large graph limits of the optimization formulations are tackled through $\Gamma$-convergence, using the recently introduced $TL^p$ metric. The small labelling noise limit of the Bayesian formulations are also identified, and contrasted with pre-existing harmonic function approaches to the problem.
Analysis of $p$-Laplacian Regularization in Semi-Supervised Learning
Oct 15, 2017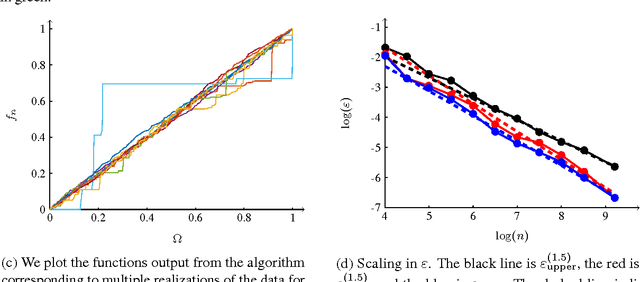
We investigate a family of regression problems in a semi-supervised setting. The task is to assign real-valued labels to a set of $n$ sample points, provided a small training subset of $N$ labeled points. A goal of semi-supervised learning is to take advantage of the (geometric) structure provided by the large number of unlabeled data when assigning labels. We consider random geometric graphs, with connection radius $\epsilon(n)$, to represent the geometry of the data set. Functionals which model the task reward the regularity of the estimator function and impose or reward the agreement with the training data. Here we consider the discrete $p$-Laplacian regularization. We investigate asymptotic behavior when the number of unlabeled points increases, while the number of training points remains fixed. We uncover a delicate interplay between the regularizing nature of the functionals considered and the nonlocality inherent to the graph constructions. We rigorously obtain almost optimal ranges on the scaling of $\epsilon(n)$ for the asymptotic consistency to hold. We prove that the minimizers of the discrete functionals in random setting converge uniformly to the desired continuum limit. Furthermore we discover that for the standard model used there is a restrictive upper bound on how quickly $\epsilon(n)$ must converge to zero as $n \to \infty$. We introduce a new model which is as simple as the original model, but overcomes this restriction.
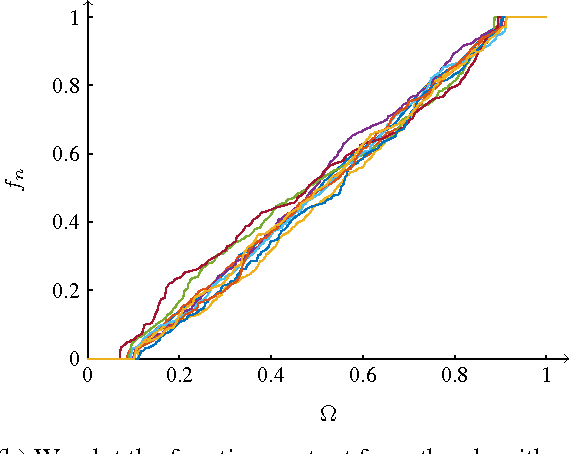
A Transportation $L^p$ Distance for Signal Analysis
Sep 27, 2016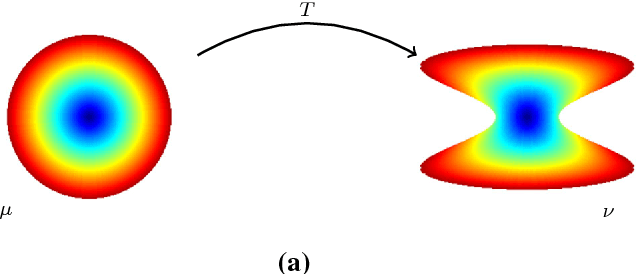
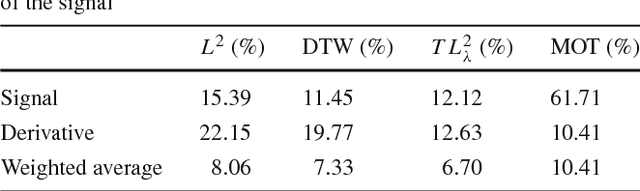
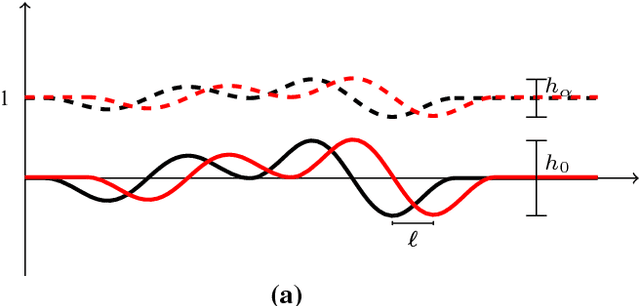
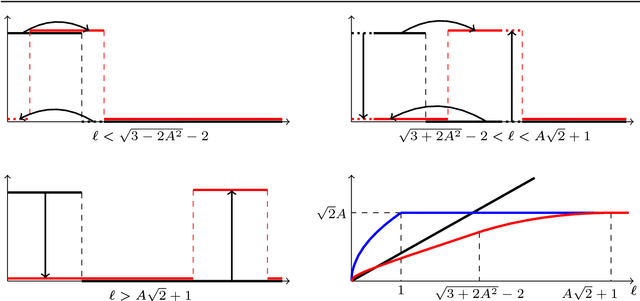
Transport based distances, such as the Wasserstein distance and earth mover's distance, have been shown to be an effective tool in signal and image analysis. The success of transport based distances is in part due to their Lagrangian nature which allows it to capture the important variations in many signal classes. However these distances require the signal to be nonnegative and normalized. Furthermore, the signals are considered as measures and compared by redistributing (transporting) them, which does not directly take into account the signal intensity. Here we study a transport-based distance, called the $TL^p$ distance, that combines Lagrangian and intensity modelling and is directly applicable to general, non-positive and multi-channelled signals. The framework allows the application of existing numerical methods. We give an overview of the basic properties of this distance and applications to classification, with multi-channelled, non-positive one and two-dimensional signals, and color transfer.
Transport-based analysis, modeling, and learning from signal and data distributions
Sep 15, 2016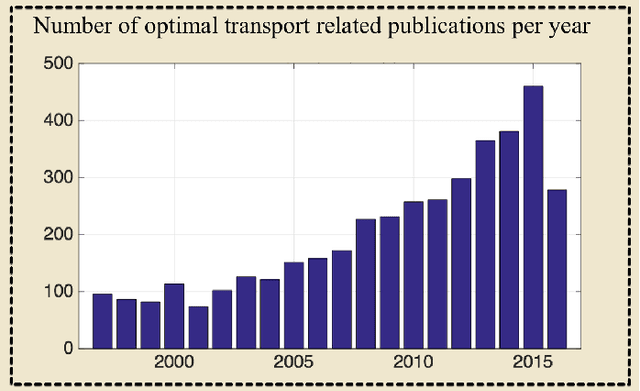
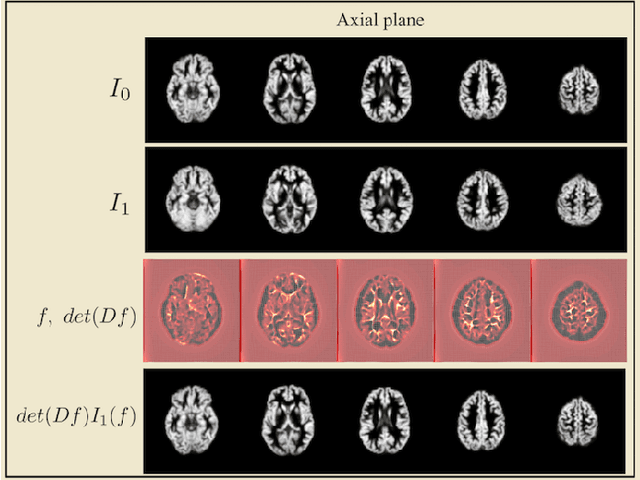
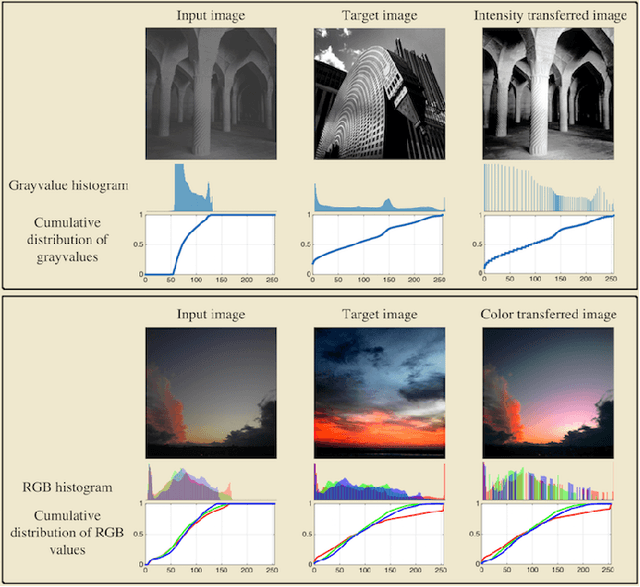
Transport-based techniques for signal and data analysis have received increased attention recently. Given their abilities to provide accurate generative models for signal intensities and other data distributions, they have been used in a variety of applications including content-based retrieval, cancer detection, image super-resolution, and statistical machine learning, to name a few, and shown to produce state of the art in several applications. Moreover, the geometric characteristics of transport-related metrics have inspired new kinds of algorithms for interpreting the meaning of data distributions. Here we provide an overview of the mathematical underpinnings of mass transport-related methods, including numerical implementation, as well as a review, with demonstrations, of several applications.