 Add to Chrome
 Add to Firefox
 Add to Edge
Manifold-Preserving Superpixel Hierarchies and Embeddings for the Exploration of High-Dimensional Images
Feb 27, 2026High-dimensional images, or images with a high-dimensional attribute vector per pixel, are commonly explored with coordinated views of a low-dimensional embedding of the attribute space and a conventional image representation. Nowadays, such images can easily contain several million pixels. For such large datasets, hierarchical embedding techniques are better suited to represent the high-dimensional attribute space than flat dimensionality reduction methods. However, available hierarchical dimensionality reduction methods construct the hierarchy purely based on the attribute information and ignore the spatial layout of pixels in the images. This impedes the exploration of regions of interest in the image space, since there is no congruence between a region of interest in image space and the associated attribute abstractions in the hierarchy. In this paper, we present a superpixel hierarchy for high-dimensional images that takes the high-dimensional attribute manifold into account during construction. Through this, our method enables consistent exploration of high-dimensional images in both image and attribute space. We show the effectiveness of this new image-guided hierarchy in the context of embedding exploration by comparing it with classical hierarchical embedding-based image exploration in two use cases.
Progressive Monitoring of Generative Model Training Evolution
Dec 17, 2024While deep generative models (DGMs) have gained popularity, their susceptibility to biases and other inefficiencies that lead to undesirable outcomes remains an issue. With their growing complexity, there is a critical need for early detection of issues to achieve desired results and optimize resources. Hence, we introduce a progressive analysis framework to monitor the training process of DGMs. Our method utilizes dimensionality reduction techniques to facilitate the inspection of latent representations, the generated and real distributions, and their evolution across training iterations. This monitoring allows us to pause and fix the training method if the representations or distributions progress undesirably. This approach allows for the analysis of a models' training dynamics and the timely identification of biases and failures, minimizing computational loads. We demonstrate how our method supports identifying and mitigating biases early in training a Generative Adversarial Network (GAN) and improving the quality of the generated data distribution.
MICCAI-CDMRI 2023 QuantConn Challenge Findings on Achieving Robust Quantitative Connectivity through Harmonized Preprocessing of Diffusion MRI
Nov 14, 2024


White matter alterations are increasingly implicated in neurological diseases and their progression. International-scale studies use diffusion-weighted magnetic resonance imaging (DW-MRI) to qualitatively identify changes in white matter microstructure and connectivity. Yet, quantitative analysis of DW-MRI data is hindered by inconsistencies stemming from varying acquisition protocols. There is a pressing need to harmonize the preprocessing of DW-MRI datasets to ensure the derivation of robust quantitative diffusion metrics across acquisitions. In the MICCAI-CDMRI 2023 QuantConn challenge, participants were provided raw data from the same individuals collected on the same scanner but with two different acquisitions and tasked with preprocessing the DW-MRI to minimize acquisition differences while retaining biological variation. Submissions are evaluated on the reproducibility and comparability of cross-acquisition bundle-wise microstructure measures, bundle shape features, and connectomics. The key innovations of the QuantConn challenge are that (1) we assess bundles and tractography in the context of harmonization for the first time, (2) we assess connectomics in the context of harmonization for the first time, and (3) we have 10x additional subjects over prior harmonization challenge, MUSHAC and 100x over SuperMUDI. We find that bundle surface area, fractional anisotropy, connectome assortativity, betweenness centrality, edge count, modularity, nodal strength, and participation coefficient measures are most biased by acquisition and that machine learning voxel-wise correction, RISH mapping, and NeSH methods effectively reduce these biases. In addition, microstructure measures AD, MD, RD, bundle length, connectome density, efficiency, and path length are least biased by these acquisition differences.
* Accepted for publication at the Journal of Machine Learning for Biomedical Imaging (MELBA) https://melba-journal.org/2024/019
NeRF-CA: Dynamic Reconstruction of X-ray Coronary Angiography with Extremely Sparse-views
Aug 29, 2024Dynamic three-dimensional (4D) reconstruction from two-dimensional X-ray coronary angiography (CA) remains a significant clinical problem. Challenges include sparse-view settings, intra-scan motion, and complex vessel morphology such as structure sparsity and background occlusion. Existing CA reconstruction methods often require extensive user interaction or large training datasets. On the other hand, Neural Radiance Field (NeRF), a promising deep learning technique, has successfully reconstructed high-fidelity static scenes for natural and medical scenes. Recent work, however, identified that sparse-views, background occlusion, and dynamics still pose a challenge when applying NeRF in the X-ray angiography context. Meanwhile, many successful works for natural scenes propose regularization for sparse-view reconstruction or scene decomposition to handle dynamics. However, these techniques do not directly translate to the CA context, where both challenges and background occlusion are significant. This paper introduces NeRF-CA, the first step toward a 4D CA reconstruction method that achieves reconstructions from sparse coronary angiograms with cardiac motion. We leverage the motion of the coronary artery to decouple the scene into a dynamic coronary artery component and static background. We combine this scene decomposition with tailored regularization techniques. These techniques enforce the separation of the coronary artery from the background by enforcing dynamic structure sparsity and scene smoothness. By uniquely combining these approaches, we achieve 4D reconstructions from as few as four angiogram sequences. This setting aligns with clinical workflows while outperforming state-of-the-art X-ray sparse-view NeRF reconstruction techniques. We validate our approach quantitatively and qualitatively using 4D phantom datasets and ablation studies.
Multi-dimensional Parameter Space Exploration for Streamline-specific Tractography
Aug 09, 2024One of the unspoken challenges of tractography is choosing the right parameters for a given dataset or bundle. In order to tackle this challenge, we explore the multi-dimensional parameter space of tractography using streamline-specific parameters (SSP). We 1) validate a state-of-the-art probabilistic tracking method using per-streamline parameters on synthetic data, and 2) show how we can gain insights into the parameter space by focusing on streamline acceptance using real-world data. We demonstrate the potential added value of SSP to the current state of tractography by showing how SSP can be used to reveal patterns in the parameter space.
The Tree of Diffusion Life: Evolutionary Embeddings to Understand the Generation Process of Diffusion Models
Jun 25, 2024Diffusion models generate high-quality samples by corrupting data with Gaussian noise and iteratively reconstructing it with deep learning, slowly transforming noisy images into refined outputs. Understanding this data evolution is important for interpretability but is complex due to its high-dimensional evolutionary nature. While traditional dimensionality reduction methods like t-distributed stochastic neighborhood embedding (t-SNE) aid in understanding high-dimensional spaces, they neglect evolutionary structure preservation. Hence, we propose Tree of Diffusion Life (TDL), a method to understand data evolution in the generative process of diffusion models. TDL samples a diffusion model's generative space via instances with varying prompts and employs image encoders to extract semantic meaning from these samples, projecting them to an intermediate space. It employs a novel evolutionary embedding algorithm that explicitly encodes the iterations while preserving the high-dimensional relations, facilitating the visualization of data evolution. This embedding leverages three metrics: a standard t-SNE loss to group semantically similar elements, a displacement loss to group elements from the same iteration step, and an instance alignment loss to align elements of the same instance across iterations. We present rectilinear and radial layouts to represent iterations, enabling comprehensive exploration. We assess various feature extractors and highlight TDL's potential with prominent diffusion models like GLIDE and Stable Diffusion with different prompt sets. TDL simplifies understanding data evolution within diffusion models, offering valuable insights into their functioning.
Unraveling the Temporal Dynamics of the Unet in Diffusion Models
Dec 17, 2023Diffusion models have garnered significant attention since they can effectively learn complex multivariate Gaussian distributions, resulting in diverse, high-quality outcomes. They introduce Gaussian noise into training data and reconstruct the original data iteratively. Central to this iterative process is a single Unet, adapting across time steps to facilitate generation. Recent work revealed the presence of composition and denoising phases in this generation process, raising questions about the Unets' varying roles. Our study dives into the dynamic behavior of Unets within denoising diffusion probabilistic models (DDPM), focusing on (de)convolutional blocks and skip connections across time steps. We propose an analytical method to systematically assess the impact of time steps and core Unet components on the final output. This method eliminates components to study causal relations and investigate their influence on output changes. The main purpose is to understand the temporal dynamics and identify potential shortcuts during inference. Our findings provide valuable insights into the various generation phases during inference and shed light on the Unets' usage patterns across these phases. Leveraging these insights, we identify redundancies in GLIDE (an improved DDPM) and improve inference time by ~27% with minimal degradation in output quality. Our ultimate goal is to guide more informed optimization strategies for inference and influence new model designs.
Class-constrained t-SNE: Combining Data Features and Class Probabilities
Aug 26, 2023Data features and class probabilities are two main perspectives when, e.g., evaluating model results and identifying problematic items. Class probabilities represent the likelihood that each instance belongs to a particular class, which can be produced by probabilistic classifiers or even human labeling with uncertainty. Since both perspectives are multi-dimensional data, dimensionality reduction (DR) techniques are commonly used to extract informative characteristics from them. However, existing methods either focus solely on the data feature perspective or rely on class probability estimates to guide the DR process. In contrast to previous work where separate views are linked to conduct the analysis, we propose a novel approach, class-constrained t-SNE, that combines data features and class probabilities in the same DR result. Specifically, we combine them by balancing two corresponding components in a cost function to optimize the positions of data points and iconic representation of classes -- class landmarks. Furthermore, an interactive user-adjustable parameter balances these two components so that users can focus on the weighted perspectives of interest and also empowers a smooth visual transition between varying perspectives to preserve the mental map. We illustrate its application potential in model evaluation and visual-interactive labeling. A comparative analysis is performed to evaluate the DR results.
Neural Spherical Harmonics for structurally coherent continuous representation of diffusion MRI signal
Aug 23, 2023


We present a novel way to model diffusion magnetic resonance imaging (dMRI) datasets, that benefits from the structural coherence of the human brain while only using data from a single subject. Current methods model the dMRI signal in individual voxels, disregarding the intervoxel coherence that is present. We use a neural network to parameterize a spherical harmonics series (NeSH) to represent the dMRI signal of a single subject from the Human Connectome Project dataset, continuous in both the angular and spatial domain. The reconstructed dMRI signal using this method shows a more structurally coherent representation of the data. Noise in gradient images is removed and the fiber orientation distribution functions show a smooth change in direction along a fiber tract. We showcase how the reconstruction can be used to calculate mean diffusivity, fractional anisotropy, and total apparent fiber density. These results can be achieved with a single model architecture, tuning only one hyperparameter. In this paper we also demonstrate how upsampling in both the angular and spatial domain yields reconstructions that are on par or better than existing methods.
Incorporating Texture Information into Dimensionality Reduction for High-Dimensional Images
Mar 02, 2022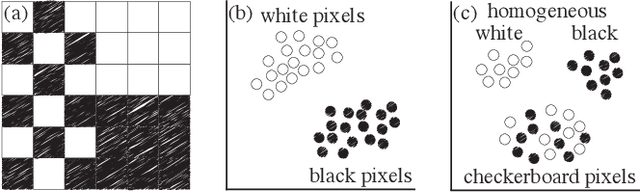
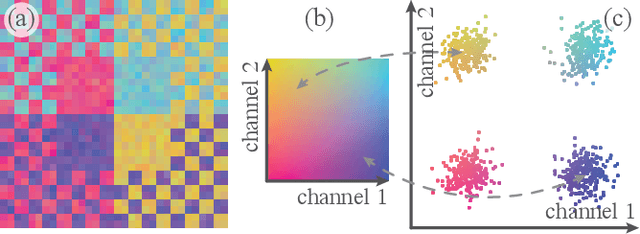
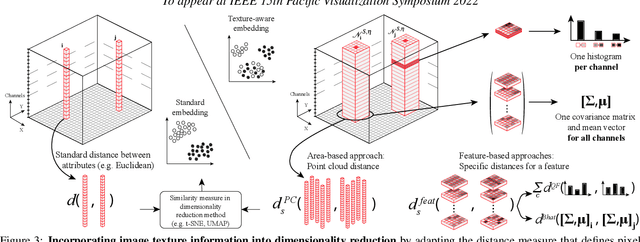
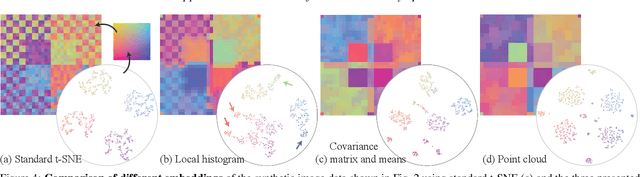
High-dimensional imaging is becoming increasingly relevant in many fields from astronomy and cultural heritage to systems biology. Visual exploration of such high-dimensional data is commonly facilitated by dimensionality reduction. However, common dimensionality reduction methods do not include spatial information present in images, such as local texture features, into the construction of low-dimensional embeddings. Consequently, exploration of such data is typically split into a step focusing on the attribute space followed by a step focusing on spatial information, or vice versa. In this paper, we present a method for incorporating spatial neighborhood information into distance-based dimensionality reduction methods, such as t-Distributed Stochastic Neighbor Embedding (t-SNE). We achieve this by modifying the distance measure between high-dimensional attribute vectors associated with each pixel such that it takes the pixel's spatial neighborhood into account. Based on a classification of different methods for comparing image patches, we explore a number of different approaches. We compare these approaches from a theoretical and experimental point of view. Finally, we illustrate the value of the proposed methods by qualitative and quantitative evaluation on synthetic data and two real-world use cases.