 Add to Chrome
 Add to Firefox
 Add to Edge
Evaluation of 3D GANs for Lung Tissue Modelling in Pulmonary CT
Aug 17, 2022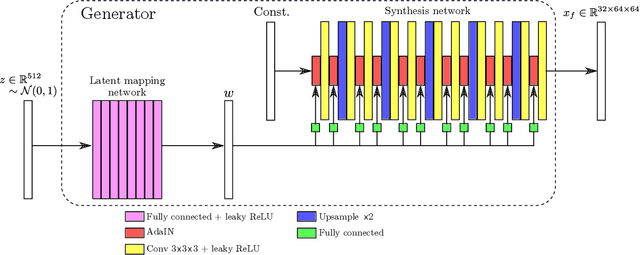
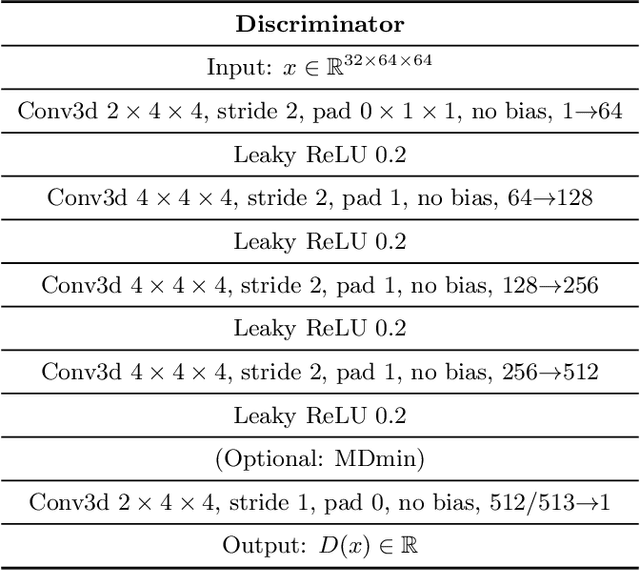
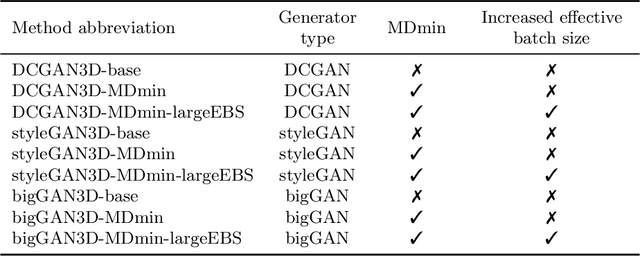
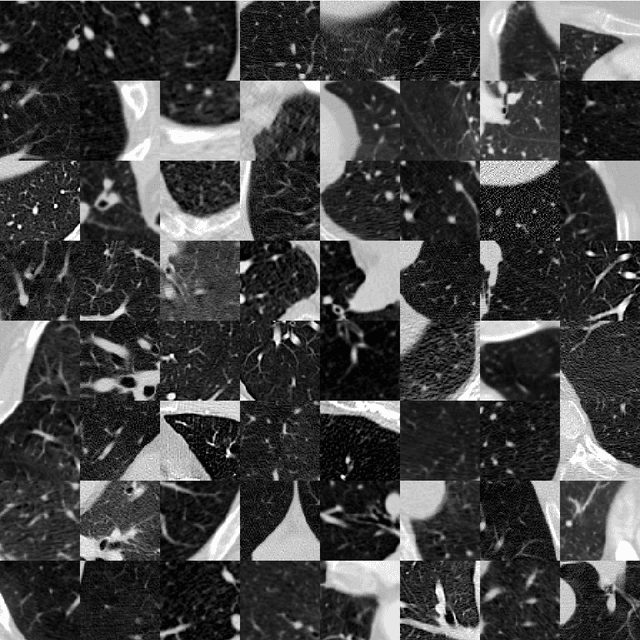
GANs are able to model accurately the distribution of complex, high-dimensional datasets, e.g. images. This makes high-quality GANs useful for unsupervised anomaly detection in medical imaging. However, differences in training datasets such as output image dimensionality and appearance of semantically meaningful features mean that GAN models from the natural image domain may not work `out-of-the-box' for medical imaging, necessitating re-implementation and re-evaluation. In this work we adapt and evaluate three GAN models to the task of modelling 3D healthy image patches for pulmonary CT. To the best of our knowledge, this is the first time that such an evaluation has been performed. The DCGAN, styleGAN and the bigGAN architectures were investigated due to their ubiquity and high performance in natural image processing. We train different variants of these methods and assess their performance using the FID score. In addition, the quality of the generated images was evaluated by a human observer study, the ability of the networks to model 3D domain-specific features was investigated, and the structure of the GAN latent spaces was analysed. Results show that the 3D styleGAN produces realistic-looking images with meaningful 3D structure, but suffer from mode collapse which must be addressed during training to obtain samples diversity. Conversely, the 3D DCGAN models show a greater capacity for image variability, but at the cost of poor-quality images. The 3D bigGAN models provide an intermediate level of image quality, but most accurately model the distribution of selected semantically meaningful features. The results suggest that future development is required to realise a 3D GAN with sufficient capacity for patch-based lung CT anomaly detection and we offer recommendations for future areas of research, such as experimenting with other architectures and incorporation of position-encoding.
Is MC Dropout Bayesian?
Oct 08, 2021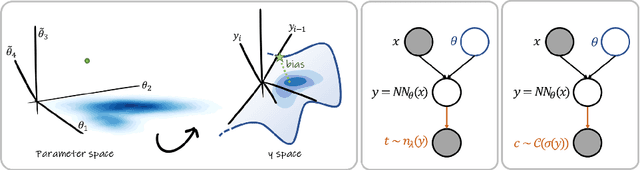
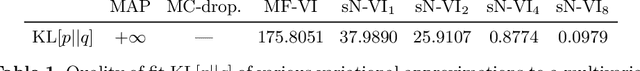
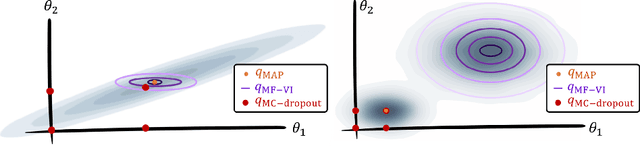
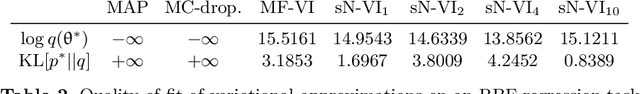
MC Dropout is a mainstream "free lunch" method in medical imaging for approximate Bayesian computations (ABC). Its appeal is to solve out-of-the-box the daunting task of ABC and uncertainty quantification in Neural Networks (NNs); to fall within the variational inference (VI) framework; and to propose a highly multimodal, faithful predictive posterior. We question the properties of MC Dropout for approximate inference, as in fact MC Dropout changes the Bayesian model; its predictive posterior assigns $0$ probability to the true model on closed-form benchmarks; the multimodality of its predictive posterior is not a property of the true predictive posterior but a design artefact. To address the need for VI on arbitrary models, we share a generic VI engine within the pytorch framework. The code includes a carefully designed implementation of structured (diagonal plus low-rank) multivariate normal variational families, and mixtures thereof. It is intended as a go-to no-free-lunch approach, addressing shortcomings of mean-field VI with an adjustable trade-off between expressivity and computational complexity.
The Pitfalls of Sample Selection: A Case Study on Lung Nodule Classification
Aug 11, 2021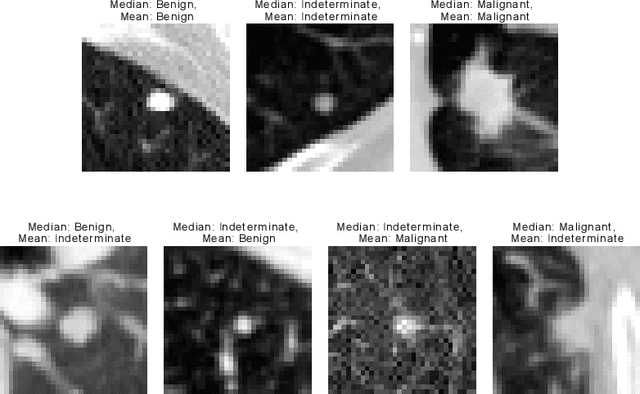
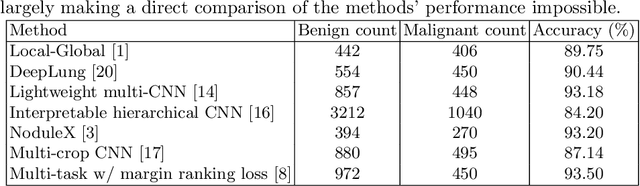
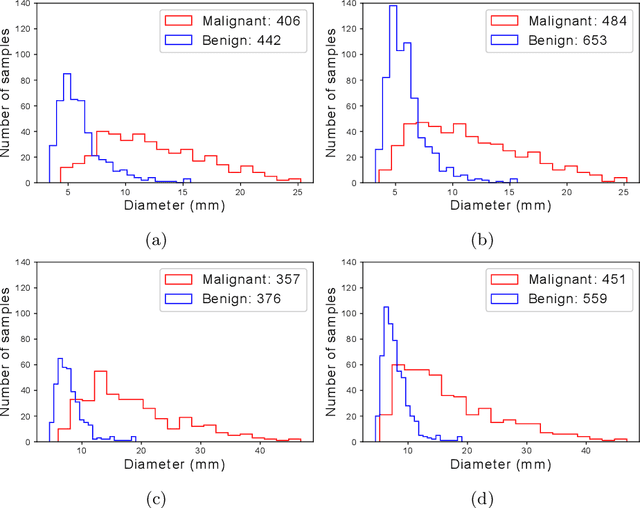
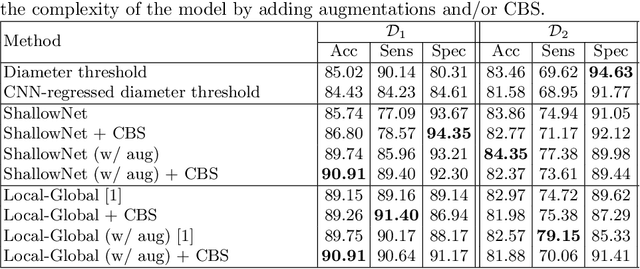
Using publicly available data to determine the performance of methodological contributions is important as it facilitates reproducibility and allows scrutiny of the published results. In lung nodule classification, for example, many works report results on the publicly available LIDC dataset. In theory, this should allow a direct comparison of the performance of proposed methods and assess the impact of individual contributions. When analyzing seven recent works, however, we find that each employs a different data selection process, leading to largely varying total number of samples and ratios between benign and malignant cases. As each subset will have different characteristics with varying difficulty for classification, a direct comparison between the proposed methods is thus not always possible, nor fair. We study the particular effect of truthing when aggregating labels from multiple experts. We show that specific choices can have severe impact on the data distribution where it may be possible to achieve superior performance on one sample distribution but not on another. While we show that we can further improve on the state-of-the-art on one sample selection, we also find that on a more challenging sample selection, on the same database, the more advanced models underperform with respect to very simple baseline methods, highlighting that the selected data distribution may play an even more important role than the model architecture. This raises concerns about the validity of claimed methodological contributions. We believe the community should be aware of these pitfalls and make recommendations on how these can be avoided in future work.
The Effect of the Loss on Generalization: Empirical Study on Synthetic Lung Nodule Data
Aug 10, 2021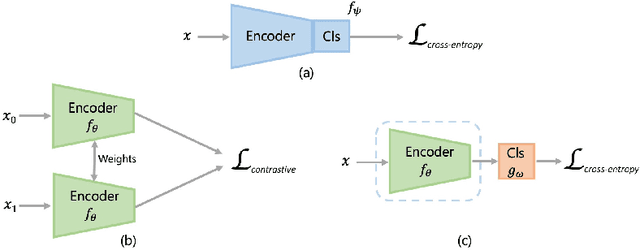
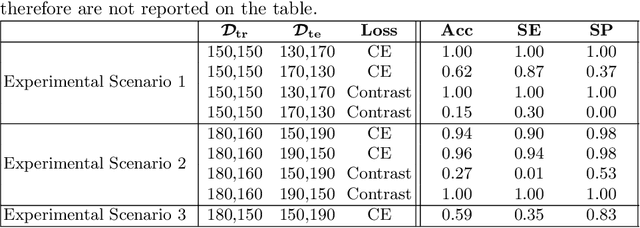
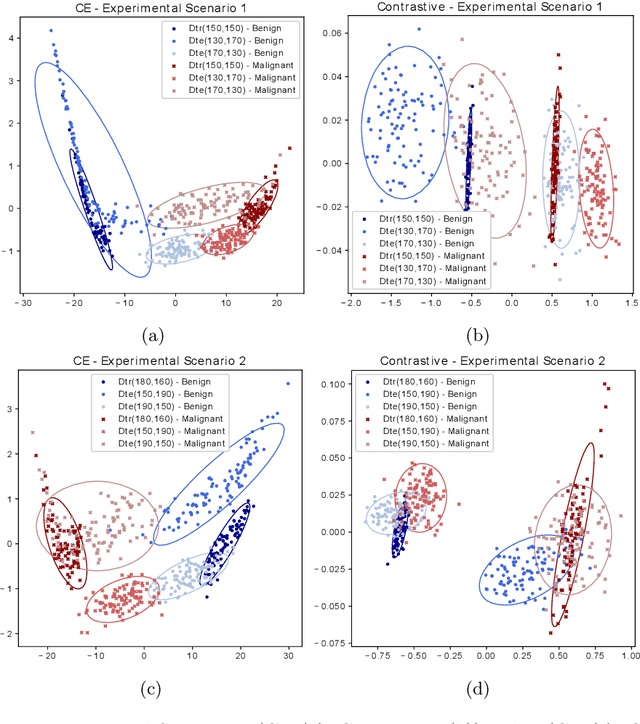
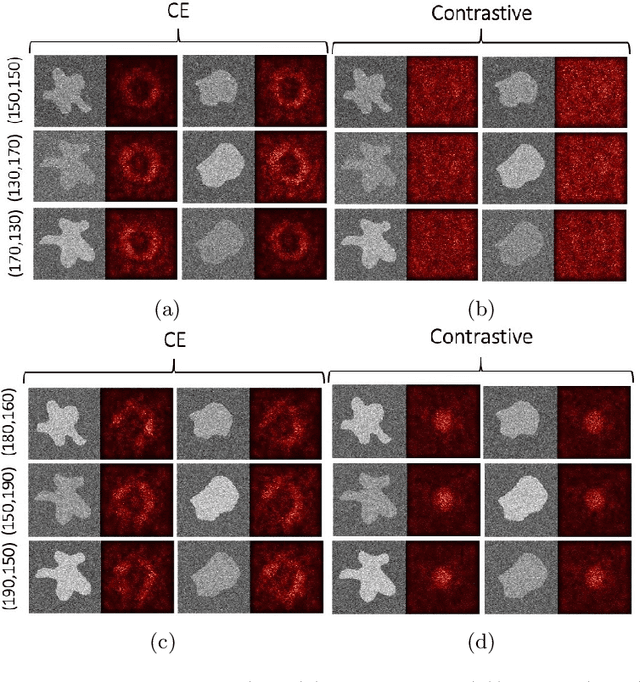
Convolutional Neural Networks (CNNs) are widely used for image classification in a variety of fields, including medical imaging. While most studies deploy cross-entropy as the loss function in such tasks, a growing number of approaches have turned to a family of contrastive learning-based losses. Even though performance metrics such as accuracy, sensitivity and specificity are regularly used for the evaluation of CNN classifiers, the features that these classifiers actually learn are rarely identified and their effect on the classification performance on out-of-distribution test samples is insufficiently explored. In this paper, motivated by the real-world task of lung nodule classification, we investigate the features that a CNN learns when trained and tested on different distributions of a synthetic dataset with controlled modes of variation. We show that different loss functions lead to different features being learned and consequently affect the generalization ability of the classifier on unseen data. This study provides some important insights into the design of deep learning solutions for medical imaging tasks.
Bayesian analysis of the prevalence bias: learning and predicting from imbalanced data
Jul 31, 2021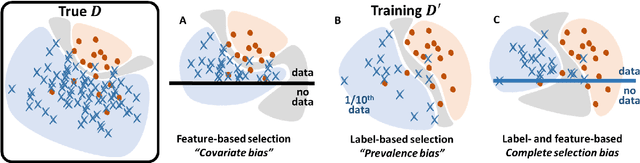
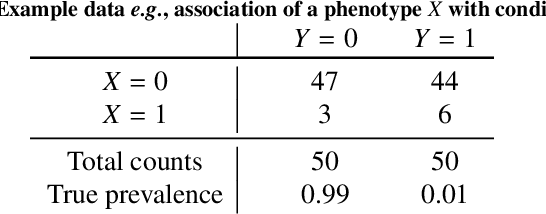
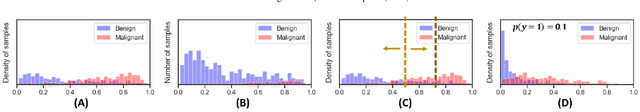
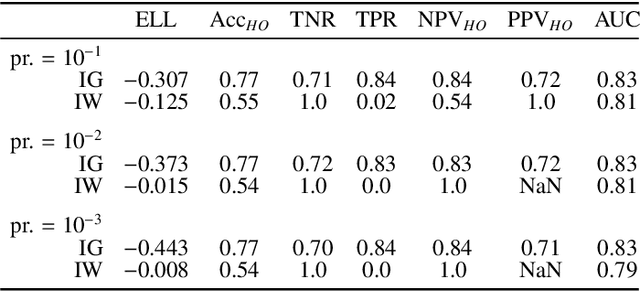
Datasets are rarely a realistic approximation of the target population. Say, prevalence is misrepresented, image quality is above clinical standards, etc. This mismatch is known as sampling bias. Sampling biases are a major hindrance for machine learning models. They cause significant gaps between model performance in the lab and in the real world. Our work is a solution to prevalence bias. Prevalence bias is the discrepancy between the prevalence of a pathology and its sampling rate in the training dataset, introduced upon collecting data or due to the practioner rebalancing the training batches. This paper lays the theoretical and computational framework for training models, and for prediction, in the presence of prevalence bias. Concretely a bias-corrected loss function, as well as bias-corrected predictive rules, are derived under the principles of Bayesian risk minimization. The loss exhibits a direct connection to the information gain. It offers a principled alternative to heuristic training losses and complements test-time procedures based on selecting an operating point from summary curves. It integrates seamlessly in the current paradigm of (deep) learning using stochastic backpropagation and naturally with Bayesian models.
SAPSAM - Sparsely Annotated Pathological Sign Activation Maps - A novel approach to train Convolutional Neural Networks on lung CT scans using binary labels only
Feb 06, 2019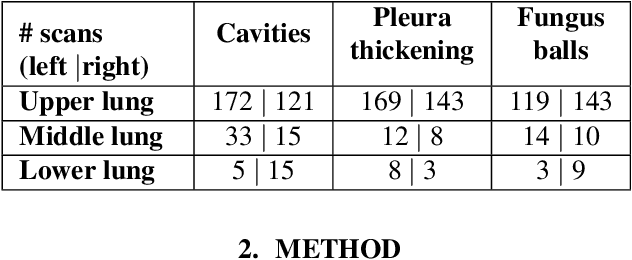
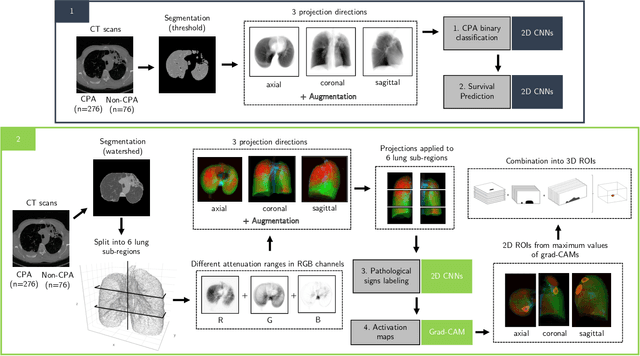
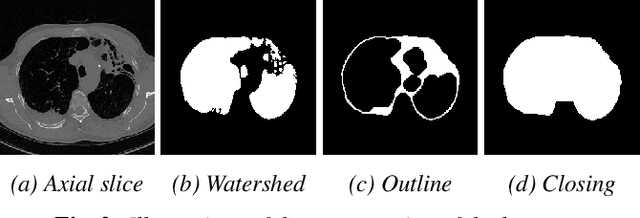
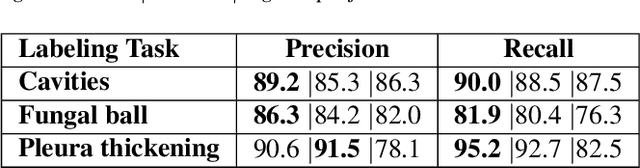
Chronic Pulmonary Aspergillosis (CPA) is a complex lung disease caused by infection with Aspergillus. Computed tomography (CT) images are frequently requested in patients with suspected and established disease, but the radiological signs on CT are difficult to quantify making accurate follow-up challenging. We propose a novel method to train Convolutional Neural Networks using only regional labels on the presence of pathological signs, to not only detect CPA, but also spatially localize pathological signs. We use average intensity projections within different ranges of Hounsfield-unit (HU) values, transforming input 3D CT scans into 2D RGB-like images. CNN architectures are trained for hierarchical tasks, leading to precise activation maps of pathological patterns. Results on a cohort of 352 subjects demonstrate high classification accuracy, localization precision and predictive power of 2 year survival. Such tool opens the way to CPA patient stratification and quantitative follow-up of CPA pathological signs, for patients under drug therapy.
* Accepted paper for ISBI2019