 Add to Chrome
 Add to Firefox
 Add to Edge
Spectral Bias Correction in PINNs for Myocardial Image Registration of Pathological Data
Apr 24, 2025


Accurate myocardial image registration is essential for cardiac strain analysis and disease diagnosis. However, spectral bias in neural networks impedes modeling high-frequency deformations, producing inaccurate, biomechanically implausible results, particularly in pathological data. This paper addresses spectral bias in physics-informed neural networks (PINNs) by integrating Fourier Feature mappings and introducing modulation strategies into a PINN framework. Experiments on two distinct datasets demonstrate that the proposed methods enhance the PINN's ability to capture complex, high-frequency deformations in cardiomyopathies, achieving superior registration accuracy while maintaining biomechanical plausibility - thus providing a foundation for scalable cardiac image registration and generalization across multiple patients and pathologies.
Towards deployment-centric multimodal AI beyond vision and language
Apr 04, 2025Multimodal artificial intelligence (AI) integrates diverse types of data via machine learning to improve understanding, prediction, and decision-making across disciplines such as healthcare, science, and engineering. However, most multimodal AI advances focus on models for vision and language data, while their deployability remains a key challenge. We advocate a deployment-centric workflow that incorporates deployment constraints early to reduce the likelihood of undeployable solutions, complementing data-centric and model-centric approaches. We also emphasise deeper integration across multiple levels of multimodality and multidisciplinary collaboration to significantly broaden the research scope beyond vision and language. To facilitate this approach, we identify common multimodal-AI-specific challenges shared across disciplines and examine three real-world use cases: pandemic response, self-driving car design, and climate change adaptation, drawing expertise from healthcare, social science, engineering, science, sustainability, and finance. By fostering multidisciplinary dialogue and open research practices, our community can accelerate deployment-centric development for broad societal impact.
High-Resolution Maps of Left Atrial Displacements and Strains Estimated with 3D CINE MRI and Unsupervised Neural Networks
Dec 14, 2023


The functional analysis of the left atrium (LA) is important for evaluating cardiac health and understanding diseases like atrial fibrillation. Cine MRI is ideally placed for the detailed 3D characterisation of LA motion and deformation, but it is lacking appropriate acquisition and analysis tools. In this paper, we present Analysis for Left Atrial Displacements and Deformations using unsupervIsed neural Networks, \textit{Aladdin}, to automatically and reliably characterise regional LA deformations from high-resolution 3D Cine MRI. The tool includes: an online few-shot segmentation network (Aladdin-S), an online unsupervised image registration network (Aladdin-R), and a strain calculations pipeline tailored to the LA. We create maps of LA Displacement Vector Field (DVF) magnitude and LA principal strain values from images of 10 healthy volunteers and 8 patients with cardiovascular disease (CVD). We additionally create an atlas of these biomarkers using the data from the healthy volunteers. Aladdin is able to accurately track the LA wall across the cardiac cycle and characterize its motion and deformation. The overall DVF magnitude and principal strain values are significantly higher in the healthy group vs CVD patients: $2.85 \pm 1.59~mm$ and $0.09 \pm 0.05$ vs $1.96 \pm 0.74~mm$ and $0.03 \pm 0.04$, respectively. The time course of these metrics is also different in the two groups, with a more marked active contraction phase observed in the healthy cohort. Finally, utilizing the LA atlas allows us to identify regional deviations from the population distribution that may indicate focal tissue abnormalities. The proposed tool for the quantification of novel regional LA deformation biomarkers should have important clinical applications. The source code, anonymized images, generated maps and atlas are publicly available: https://github.com/cgalaz01/aladdin_cmr_la.
High-resolution 3D Maps of Left Atrial Displacements using an Unsupervised Image Registration Neural Network
Sep 05, 2023

Functional analysis of the left atrium (LA) plays an increasingly important role in the prognosis and diagnosis of cardiovascular diseases. Echocardiography-based measurements of LA dimensions and strains are useful biomarkers, but they provide an incomplete picture of atrial deformations. High-resolution dynamic magnetic resonance images (Cine MRI) offer the opportunity to examine LA motion and deformation in 3D, at higher spatial resolution and with full LA coverage. However, there are no dedicated tools to automatically characterise LA motion in 3D. Thus, we propose a tool that automatically segments the LA and extracts the displacement fields across the cardiac cycle. The pipeline is able to accurately track the LA wall across the cardiac cycle with an average Hausdorff distance of $2.51 \pm 1.3~mm$ and Dice score of $0.96 \pm 0.02$.
Prototype of a Cardiac MRI Simulator for the Training of Supervised Neural Networks
May 25, 2023Supervised deep learning methods typically rely on large datasets for training. Ethical and practical considerations usually make it difficult to access large amounts of healthcare data, such as medical images, with known task-specific ground truth. This hampers the development of adequate, unbiased and robust deep learning methods for clinical tasks. Magnetic Resonance Images (MRI) are the result of several complex physical and engineering processes and the generation of synthetic MR images provides a formidable challenge. Here, we present the first results of ongoing work to create a generator for large synthetic cardiac MR image datasets. As an application for the simulator, we show how the synthetic images can be used to help train a supervised neural network that estimates the volume of the left ventricular myocardium directly from cardiac MR images. Despite its current limitations, our generator may in the future help address the current shortage of labelled cardiac MRI needed for the development of supervised deep learning tools. It is likely to also find applications in the development of image reconstruction methods and tools to improve robustness, verification and interpretability of deep networks in this setting.
PAT-CNN: Automatic Segmentation and Quantification of Pericardial Adipose Tissue from T2-Weighted Cardiac Magnetic Resonance Images
Nov 09, 2022Background: Increased pericardial adipose tissue (PAT) is associated with many types of cardiovascular disease (CVD). Although cardiac magnetic resonance images (CMRI) are often acquired in patients with CVD, there are currently no tools to automatically identify and quantify PAT from CMRI. The aim of this study was to create a neural network to segment PAT from T2-weighted CMRI and explore the correlations between PAT volumes (PATV) and CVD outcomes and mortality. Methods: We trained and tested a deep learning model, PAT-CNN, to segment PAT on T2-weighted cardiac MR images. Using the segmentations from PAT-CNN, we automatically calculated PATV on images from 391 patients. We analysed correlations between PATV and CVD diagnosis and 1-year mortality post-imaging. Results: PAT-CNN was able to accurately segment PAT with Dice score/ Hausdorff distances of 0.74 +- 0.03/27.1 +- 10.9~mm, similar to the values obtained when comparing the segmentations of two independent human observers ($0.76 +- 0.06/21.2 +- 10.3~mm$). Regression models showed that, independently of sex and body-mass index, PATV is significantly positively correlated with a diagnosis of CVD and with 1-year all cause mortality (p-value < 0.01). Conclusions: PAT-CNN can segment PAT from T2-weighted CMR images automatically and accurately. Increased PATV as measured automatically from CMRI is significantly associated with the presence of CVD and can independently predict 1-year mortality.
Tempera: Spatial Transformer Feature Pyramid Network for Cardiac MRI Segmentation
Mar 01, 2022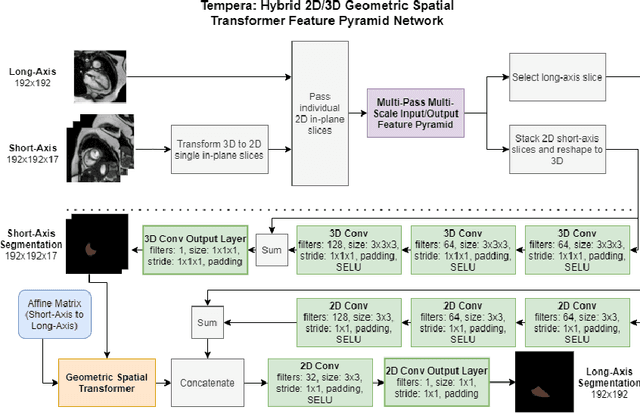
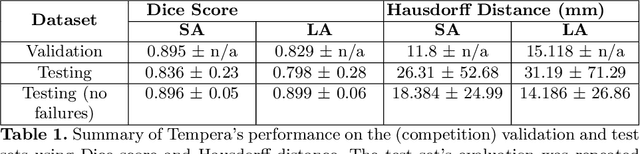
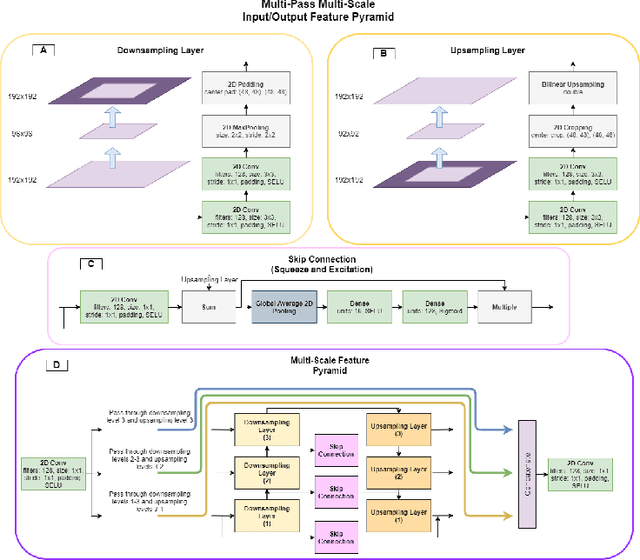
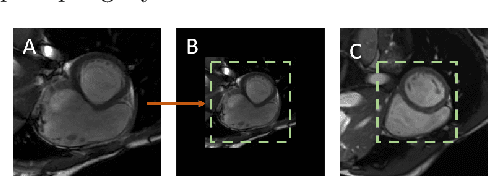
Assessing the structure and function of the right ventricle (RV) is important in the diagnosis of several cardiac pathologies. However, it remains more challenging to segment the RV than the left ventricle (LV). In this paper, we focus on segmenting the RV in both short (SA) and long-axis (LA) cardiac MR images simultaneously. For this task, we propose a new multi-input/output architecture, hybrid 2D/3D geometric spatial TransformEr Multi-Pass fEature pyRAmid (Tempera). Our feature pyramid extends current designs by allowing not only a multi-scale feature output but multi-scale SA and LA input images as well. Tempera transfers learned features between SA and LA images via layer weight sharing and incorporates a geometric target transformer to map the predicted SA segmentation to LA space. Our model achieves an average Dice score of 0.836 and 0.798 for the SA and LA, respectively, and 26.31 mm and 31.19 mm Hausdorff distances. This opens up the potential for the incorporation of RV segmentation models into clinical workflows.
Deep Learning methods for automatic evaluation of delayed enhancement-MRI. The results of the EMIDEC challenge
Aug 10, 2021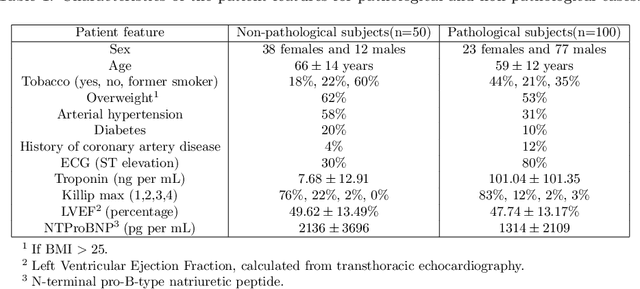
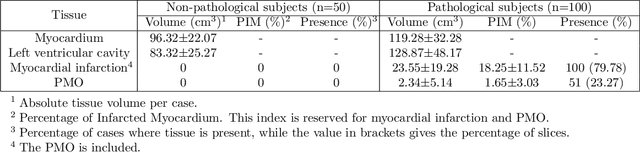
A key factor for assessing the state of the heart after myocardial infarction (MI) is to measure whether the myocardium segment is viable after reperfusion or revascularization therapy. Delayed enhancement-MRI or DE-MRI, which is performed several minutes after injection of the contrast agent, provides high contrast between viable and nonviable myocardium and is therefore a method of choice to evaluate the extent of MI. To automatically assess myocardial status, the results of the EMIDEC challenge that focused on this task are presented in this paper. The challenge's main objectives were twofold. First, to evaluate if deep learning methods can distinguish between normal and pathological cases. Second, to automatically calculate the extent of myocardial infarction. The publicly available database consists of 150 exams divided into 50 cases with normal MRI after injection of a contrast agent and 100 cases with myocardial infarction (and then with a hyperenhanced area on DE-MRI), whatever their inclusion in the cardiac emergency department. Along with MRI, clinical characteristics are also provided. The obtained results issued from several works show that the automatic classification of an exam is a reachable task (the best method providing an accuracy of 0.92), and the automatic segmentation of the myocardium is possible. However, the segmentation of the diseased area needs to be improved, mainly due to the small size of these areas and the lack of contrast with the surrounding structures.