 Add to Chrome
 Add to Firefox
 Add to Edge
"Time Series Analysis": models, code, and papers
Enhancing Identification of Structure Function of Academic Articles Using Contextual Information
Dec 02, 2021
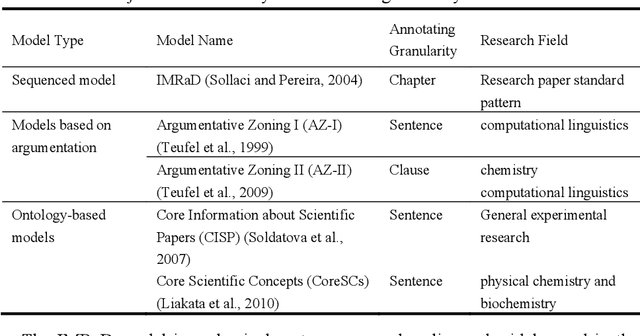
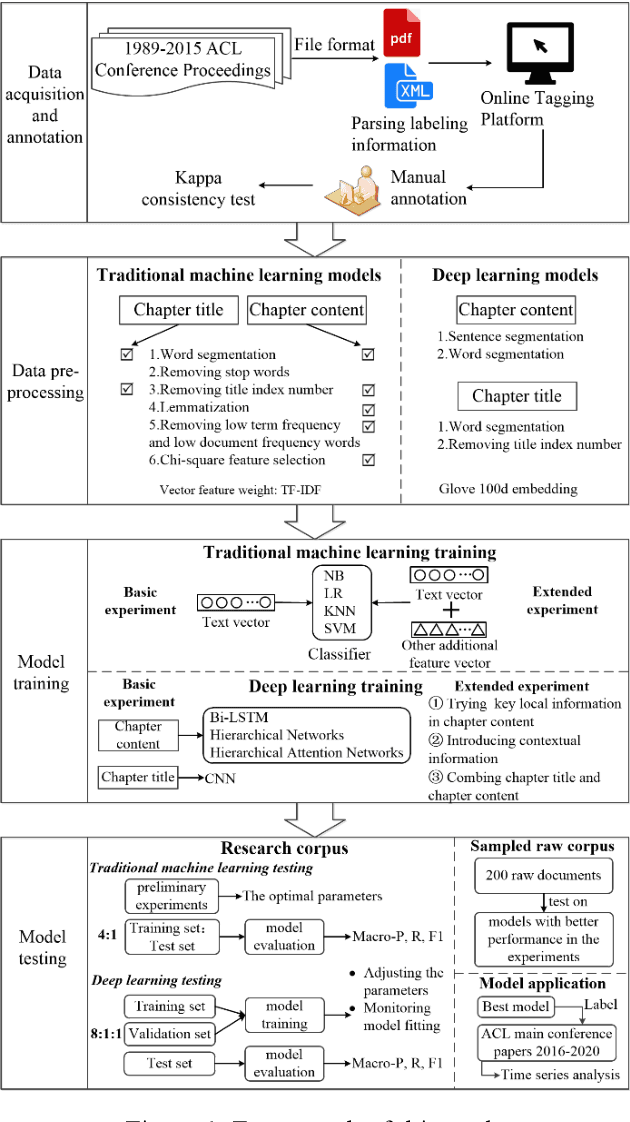
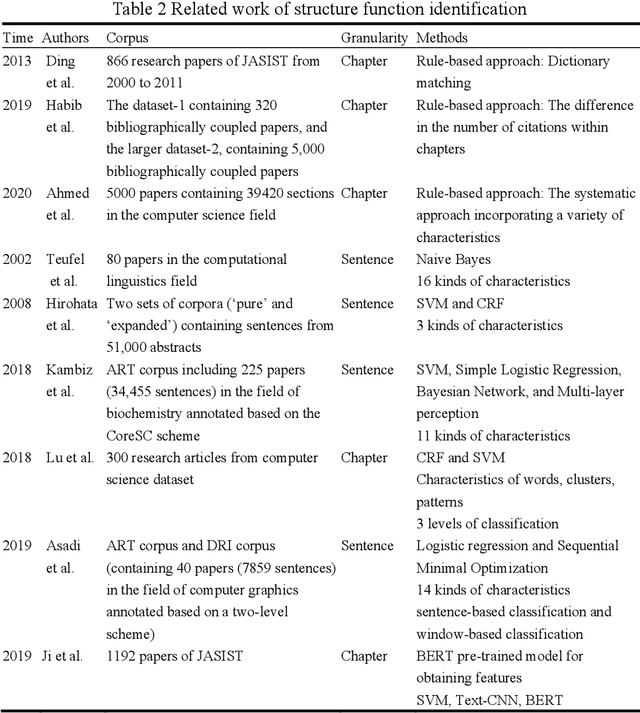
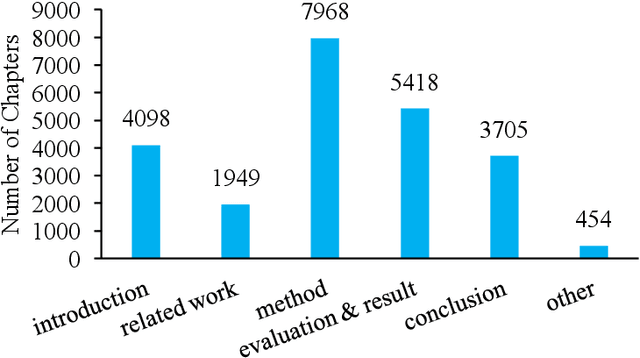
With the enrichment of literature resources, researchers are facing the growing problem of information explosion and knowledge overload. To help scholars retrieve literature and acquire knowledge successfully, clarifying the semantic structure of the content in academic literature has become the essential research question. In the research on identifying the structure function of chapters in academic articles, only a few studies used the deep learning model and explored the optimization for feature input. This limits the application, optimization potential of deep learning models for the research task. This paper took articles of the ACL conference as the corpus. We employ the traditional machine learning models and deep learning models to construct the classifiers based on various feature input. Experimental results show that (1) Compared with the chapter content, the chapter title is more conducive to identifying the structure function of academic articles. (2) Relative position is a valuable feature for building traditional models. (3) Inspired by (2), this paper further introduces contextual information into the deep learning models and achieved significant results. Meanwhile, our models show good migration ability in the open test containing 200 sampled non-training samples. We also annotated the ACL main conference papers in recent five years based on the best practice performing models and performed a time series analysis of the overall corpus. This work explores and summarizes the practical features and models for this task through multiple comparative experiments and provides a reference for related text classification tasks. Finally, we indicate the limitations and shortcomings of the current model and the direction of further optimization.
A Time Series Analysis-Based Stock Price Prediction Using Machine Learning and Deep Learning Models
Apr 17, 2020
Prediction of future movement of stock prices has always been a challenging task for the researchers. While the advocates of the efficient market hypothesis (EMH) believe that it is impossible to design any predictive framework that can accurately predict the movement of stock prices, there are seminal work in the literature that have clearly demonstrated that the seemingly random movement patterns in the time series of a stock price can be predicted with a high level of accuracy. Design of such predictive models requires choice of appropriate variables, right transformation methods of the variables, and tuning of the parameters of the models. In this work, we present a very robust and accurate framework of stock price prediction that consists of an agglomeration of statistical, machine learning and deep learning models. We use the daily stock price data, collected at five minutes interval of time, of a very well known company that is listed in the National Stock Exchange (NSE) of India. The granular data is aggregated into three slots in a day, and the aggregated data is used for building and training the forecasting models. We contend that the agglomerative approach of model building that uses a combination of statistical, machine learning, and deep learning approaches, can very effectively learn from the volatile and random movement patterns in a stock price data. We build eight classification and eight regression models based on statistical and machine learning approaches. In addition to these models, a deep learning regression model using a long-and-short-term memory (LSTM) network is also built. Extensive results have been presented on the performance of these models, and the results are critically analyzed.
* 46 Pages, 36 Figures, 21 Tables
Spectrum of non-Hermitian deep-Hebbian neural networks
Aug 24, 2022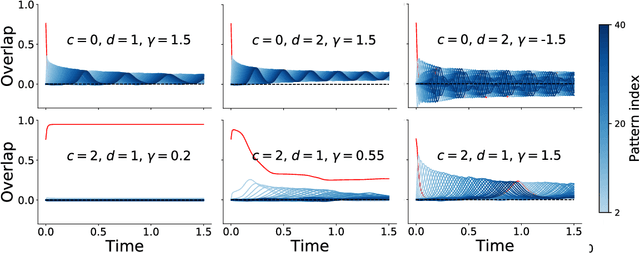
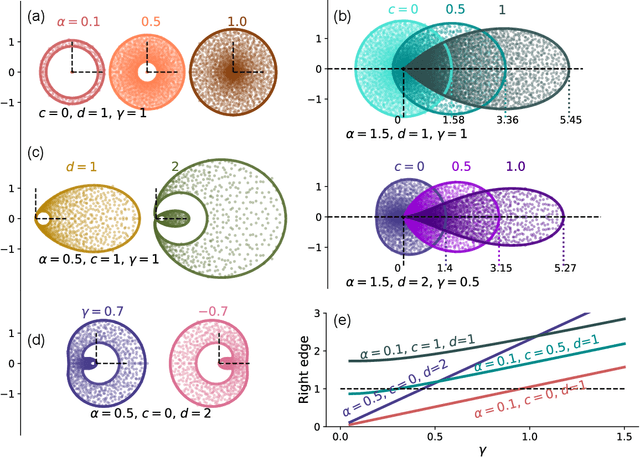
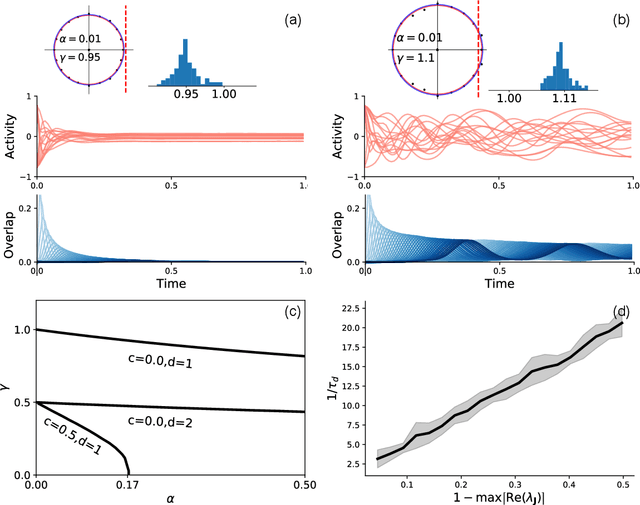
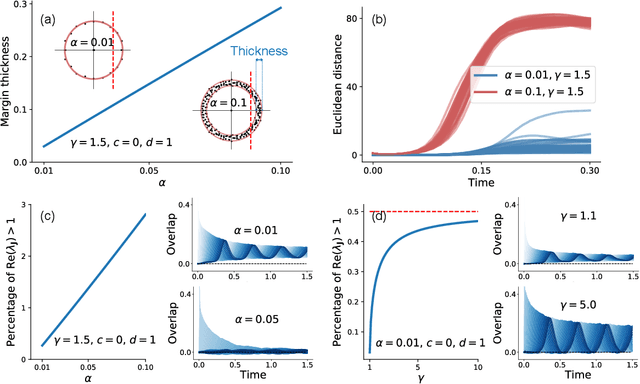
Neural networks with recurrent asymmetric couplings are important to understand how episodic memories are encoded in the brain. Here, we integrate the experimental observation of wide synaptic integration window into our model of sequence retrieval in the continuous time dynamics. The model with non-normal neuron-interactions is theoretically studied by deriving a random matrix theory of the Jacobian matrix in neural dynamics. The spectra bears several distinct features, such as breaking rotational symmetry about the origin, and the emergence of nested voids within the spectrum boundary. The spectral density is thus highly non-uniformly distributed in the complex plane. The random matrix theory also predicts a transition to chaos. In particular, the edge of chaos provides computational benefits for the sequential retrieval of memories. Our work provides a systematic study of time-lagged correlations with arbitrary time delays, and thus can inspire future studies of a broad class of memory models, and even big data analysis of biological time series.
Signal Restoration and Channel Estimation for Channel Sounding with SDRs
May 23, 2022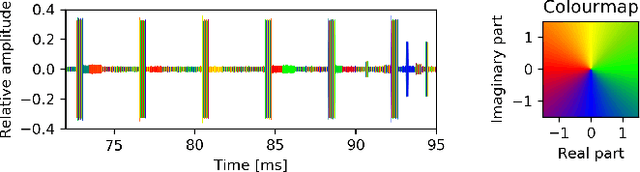
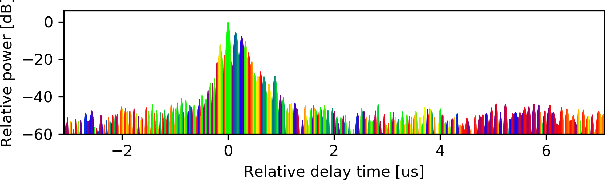
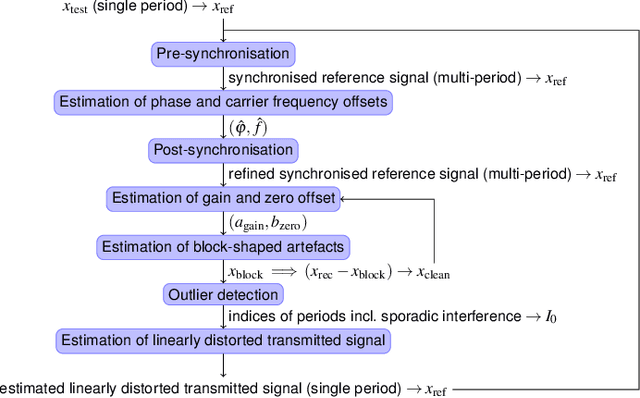
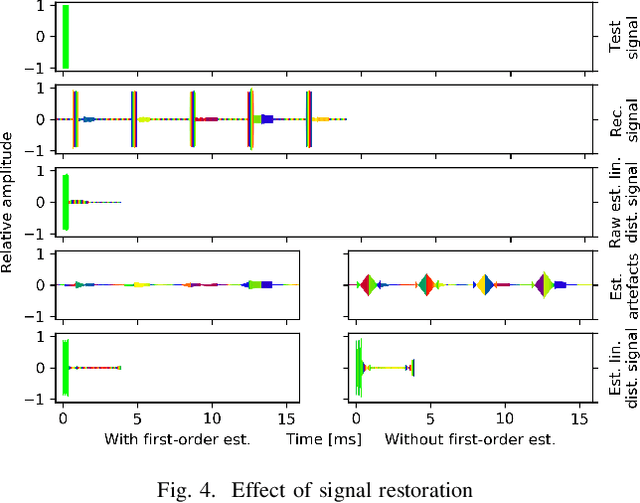
In this paper, the task of channel sounding using software defined radios (SDRs) is considered. In contrast to classical channel sounding equipment, SDRs are general purpose devices and require additional steps to be implemented when employed for this task. On top of this, SDRs may exhibit quirks causing signal artefacts that obstruct the effective collection of channel estimation data. Based on these considerations, in this work, a practical algorithm is devised to compensate for the drawbacks of using SDRs for channel sounding encountered in a concrete setup. The proposed approach utilises concepts from time series and Fourier analysis and comprises a signal restoration routine for mitigating artefacts within the recorded signals and an encompassing channel sounding process. The efficacy of the algorithm is evaluated on real measurements generated within the given setup. The empirical results show that the proposed method is able to counteract the shortcomings of the equipment and deliver reasonable channel estimates.
Demand Forecasting in Smart Grid Using Long Short-Term Memory
Jul 28, 2021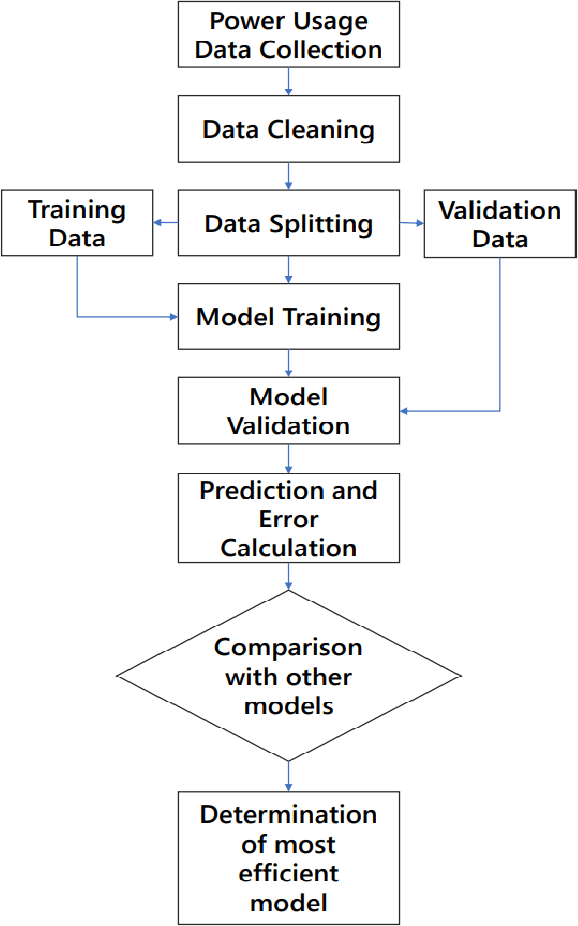
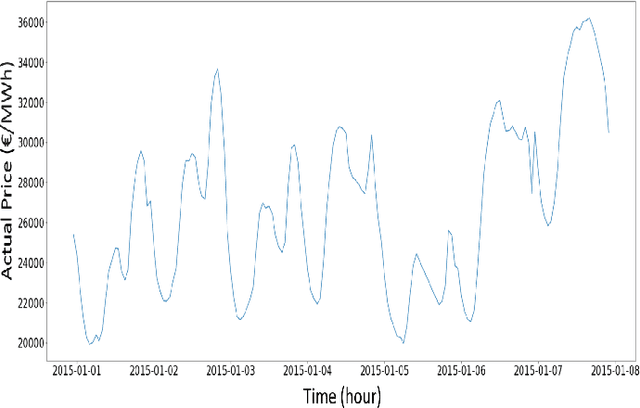
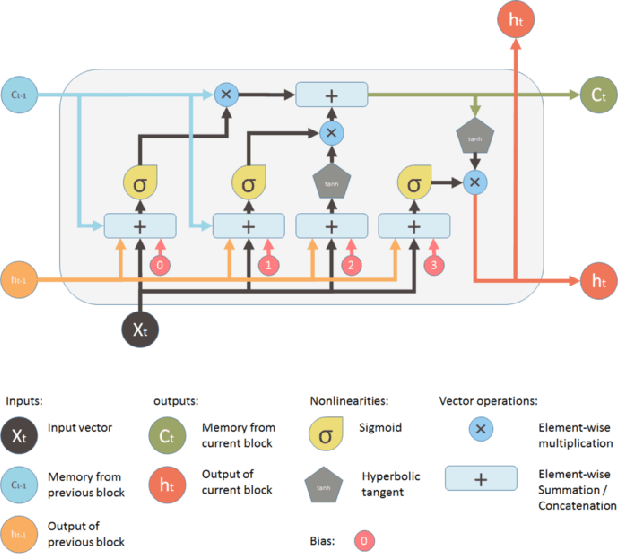
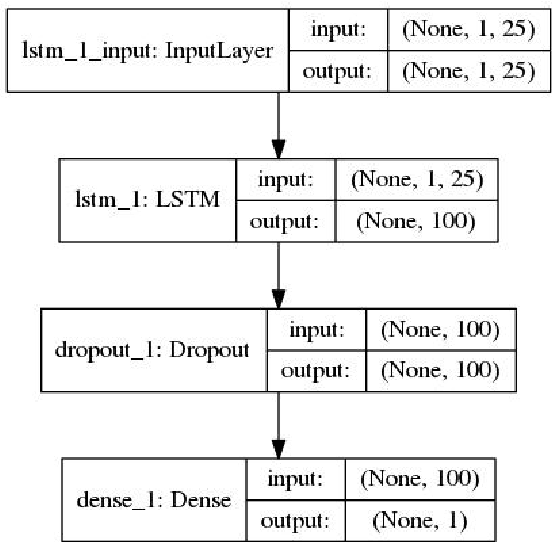
Demand forecasting in power sector has become an important part of modern demand management and response systems with the rise of smart metering enabled grids. Long Short-Term Memory (LSTM) shows promising results in predicting time series data which can also be applied to power load demand in smart grids. In this paper, an LSTM based model using neural network architecture is proposed to forecast power demand. The model is trained with hourly energy and power usage data of four years from a smart grid. After training and prediction, the accuracy of the model is compared against the traditional statistical time series analysis algorithms, such as Auto-Regressive (AR), to determine the efficiency. The mean absolute percentile error is found to be 1.22 in the proposed LSTM model, which is the lowest among the other models. From the findings, it is clear that the inclusion of neural network in predicting power demand reduces the error of prediction significantly. Thus, the application of LSTM can enable a more efficient demand response system.
Normalized multivariate time series causality analysis and causal graph reconstruction
Apr 23, 2021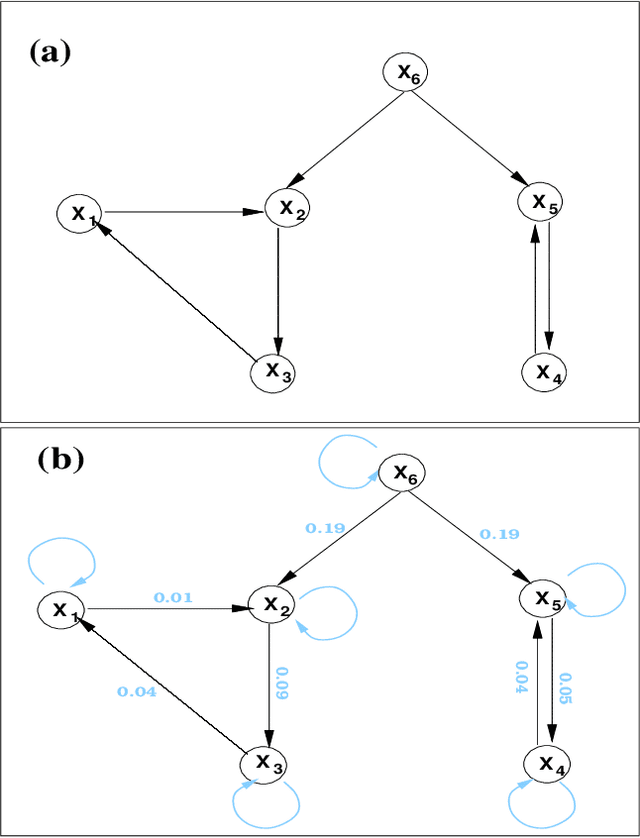
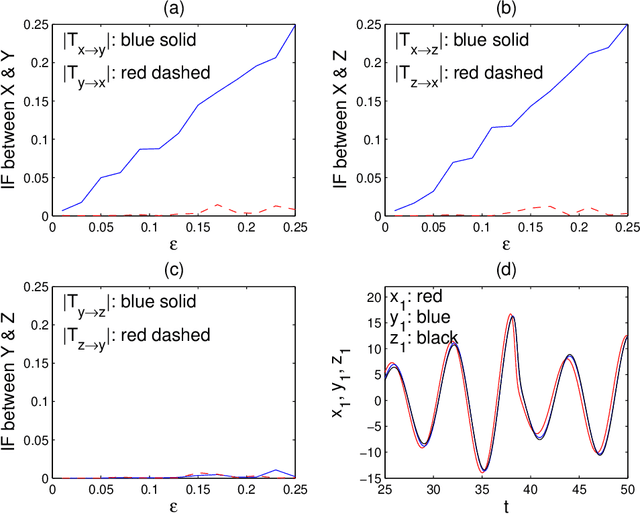
Causality analysis is an important problem lying at the heart of science, and is of particular importance in data science and machine learning. An endeavor during the past 16 years viewing causality as real physical notion so as to formulate it from first principles, however, seems to go unnoticed. This study introduces to the community this line of work, with a long-due generalization of the information flow-based bivariate time series causal inference to multivariate series, based on the recent advance in theoretical development. The resulting formula is transparent, and can be implemented as a computationally very efficient algorithm for application. It can be normalized, and tested for statistical significance. Different from the previous work along this line where only information flows are estimated, here an algorithm is also implemented to quantify the influence of a unit to itself. While this forms a challenge in some causal inferences, here it comes naturally, and hence the identification of self-loops in a causal graph is fulfilled automatically as the causalities along edges are inferred. To demonstrate the power of the approach, presented here are two applications in extreme situations. The first is a network of multivariate processes buried in heavy noises (with the noise-to-signal ratio exceeding 100), and the second a network with nearly synchronized chaotic oscillators. In both graphs, confounding processes exist. While it seems to be a huge challenge to reconstruct from given series these causal graphs, an easy application of the algorithm immediately reveals the desideratum. Particularly, the confounding processes have been accurately differentiated. Considering the surge of interest in the community, this study is very timely.
Tripletformer for Probabilistic Interpolation of Asynchronous Time Series
Oct 05, 2022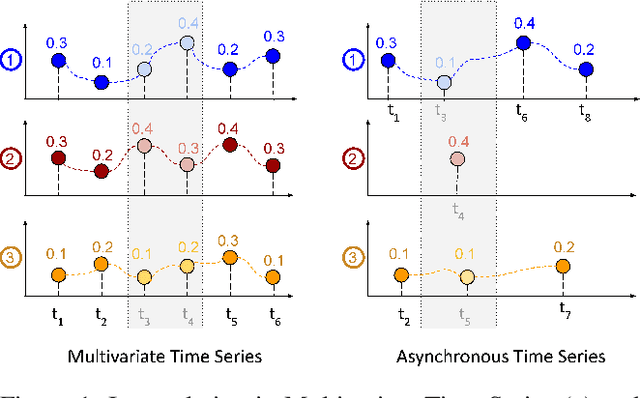
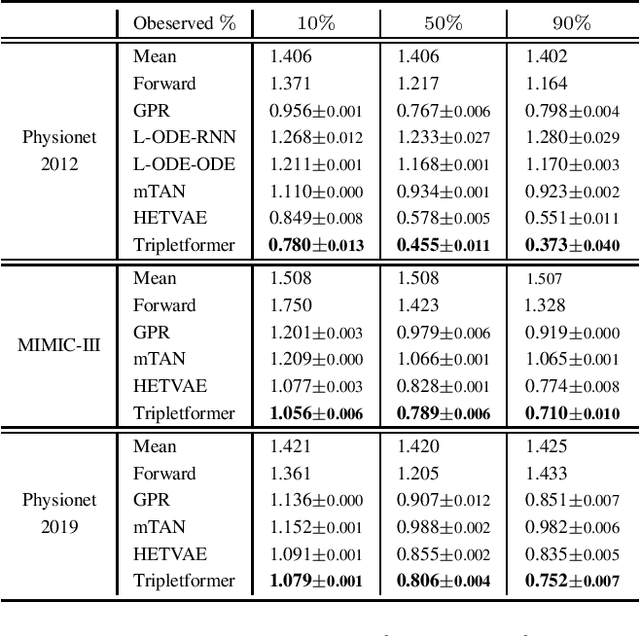
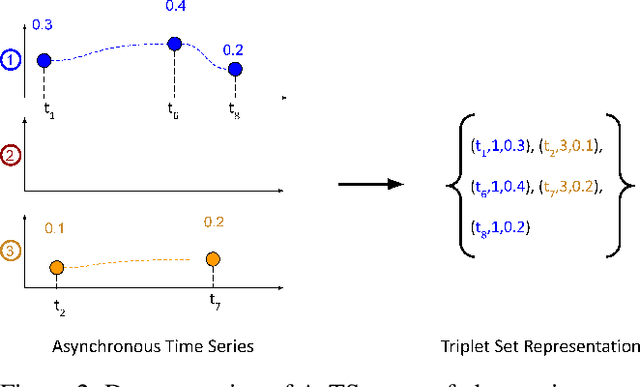
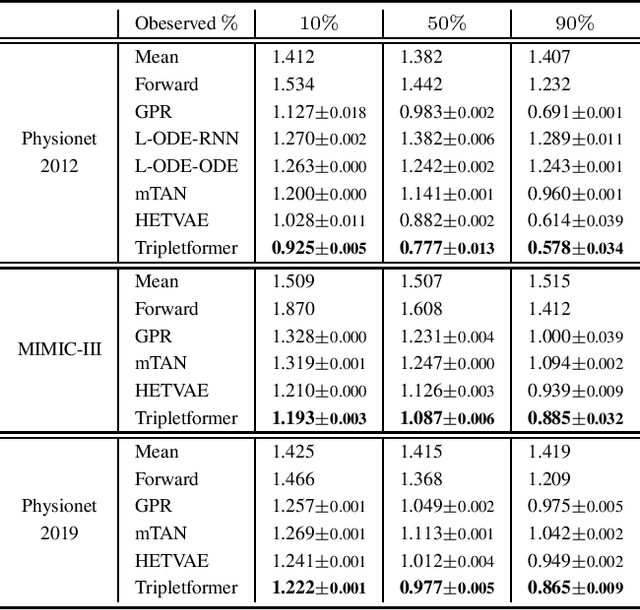
Asynchronous time series are often observed in several applications such as health care, astronomy, and climate science, and pose a significant challenge to the standard deep learning architectures. Interpolation of asynchronous time series is vital for many real-world tasks like root cause analysis, and medical diagnosis. In this paper, we propose a novel encoder-decoder architecture called Tripletformer, which works on the set of observations where each set element is a triple of time, channel, and value, for the probabilistic interpolation of the asynchronous time series. Both the encoder and the decoder of the Tripletformer are modeled using attention layers and fully connected layers and are invariant to the order in which set elements are presented. The proposed Tripletformer is compared with a range of baselines over multiple real-world and synthetic asynchronous time series datasets, and the experimental results attest that it produces more accurate and certain interpolations. We observe an improvement in negative loglikelihood error up to 33% over real and 800% over synthetic asynchronous time series datasets compared to the state-of-the-art model using the Tripletformer.
Extraction of instantaneous frequencies and amplitudes in nonstationary time-series data
Apr 03, 2021
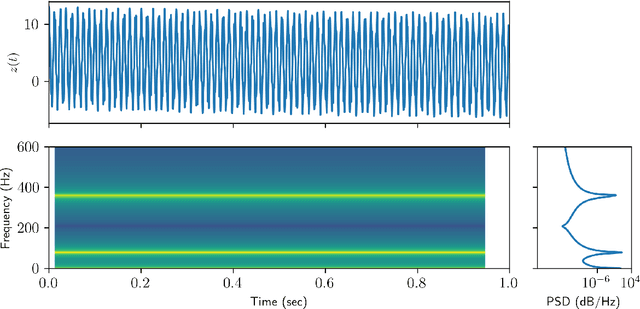
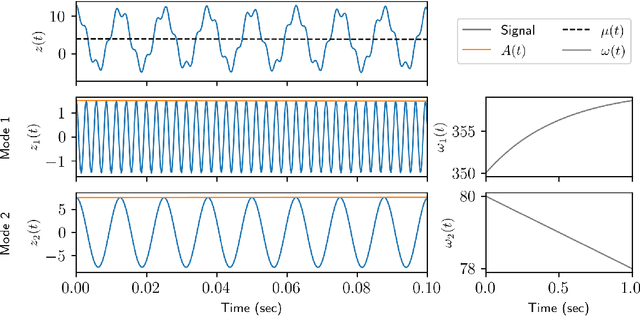
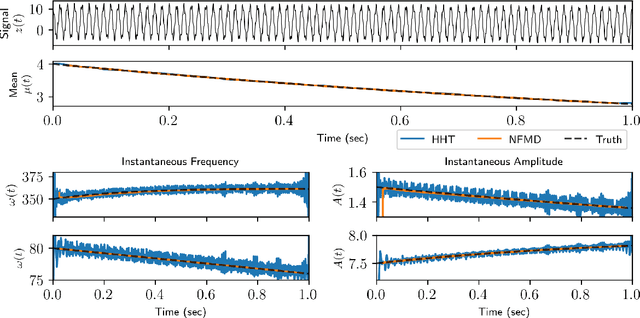
Time-series analysis is critical for a diversity of applications in science and engineering. By leveraging the strengths of modern gradient descent algorithms, the Fourier transform, multi-resolution analysis, and Bayesian spectral analysis, we propose a data-driven approach to time-frequency analysis that circumvents many of the shortcomings of classic approaches, including the extraction of nonstationary signals with discontinuities in their behavior. The method introduced is equivalent to a {\em nonstationary Fourier mode decomposition} (NFMD) for nonstationary and nonlinear temporal signals, allowing for the accurate identification of instantaneous frequencies and their amplitudes. The method is demonstrated on a diversity of time-series data, including on data from cantilever-based electrostatic force microscopy to quantify the time-dependent evolution of charging dynamics at the nanoscale.
GrowliFlower: An image time series dataset for GROWth analysis of cauLIFLOWER
Apr 01, 2022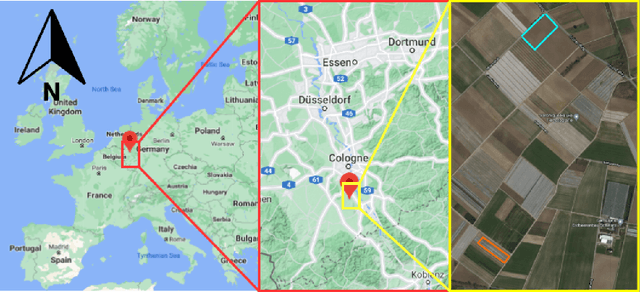
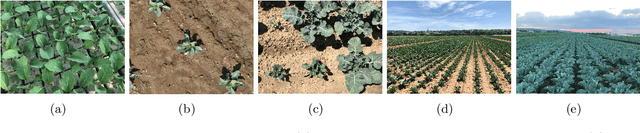
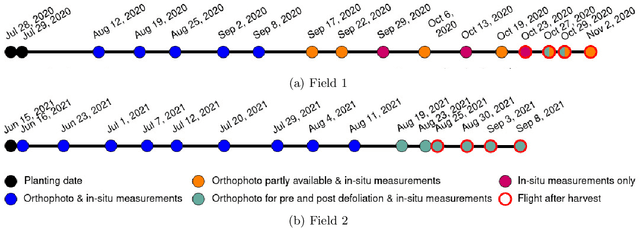
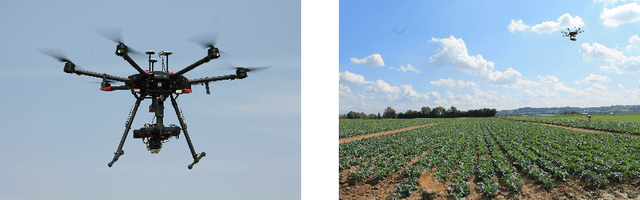
This article presents GrowliFlower, a georeferenced, image-based UAV time series dataset of two monitored cauliflower fields of size 0.39 and 0.60 ha acquired in 2020 and 2021. The dataset contains RGB and multispectral orthophotos from which about 14,000 individual plant coordinates are derived and provided. The coordinates enable the dataset users the extraction of complete and incomplete time series of image patches showing individual plants. The dataset contains collected phenotypic traits of 740 plants, including the developmental stage as well as plant and cauliflower size. As the harvestable product is completely covered by leaves, plant IDs and coordinates are provided to extract image pairs of plants pre and post defoliation, to facilitate estimations of cauliflower head size. Moreover, the dataset contains pixel-accurate leaf and plant instance segmentations, as well as stem annotations to address tasks like classification, detection, segmentation, instance segmentation, and similar computer vision tasks. The dataset aims to foster the development and evaluation of machine learning approaches. It specifically focuses on the analysis of growth and development of cauliflower and the derivation of phenotypic traits to foster the development of automation in agriculture. Two baseline results of instance segmentation at plant and leaf level based on the labeled instance segmentation data are presented. The entire data set is publicly available.
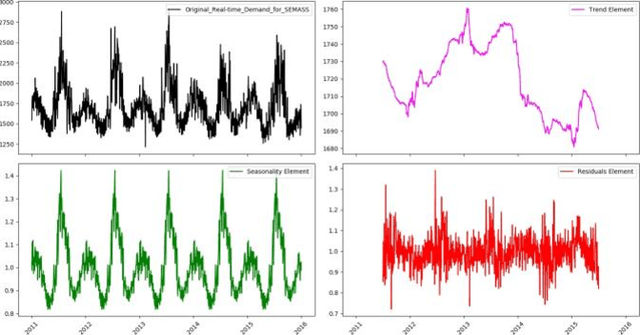
Time Series Analysis of Big Data for Electricity Price and Demand to Find Cyber-Attacks part 2: Decomposition Analysis
Jul 30, 2019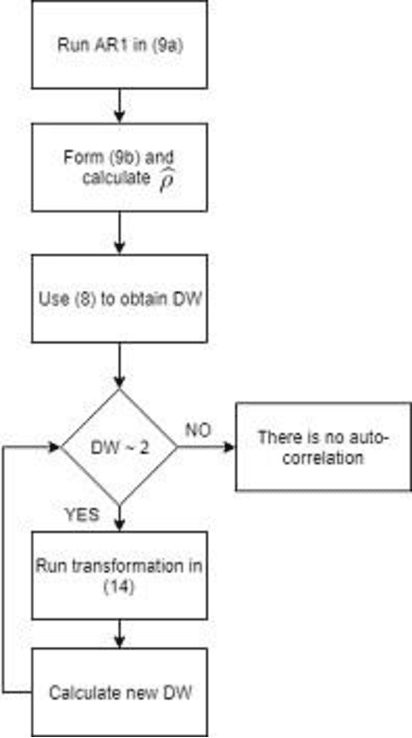
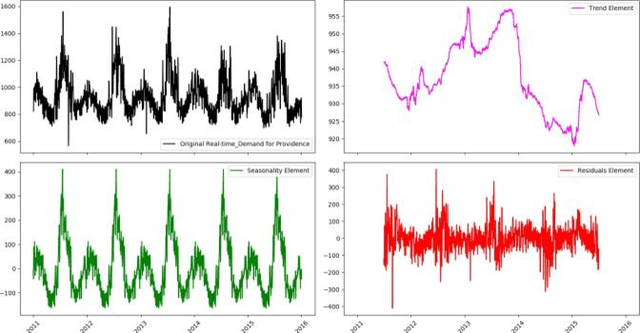
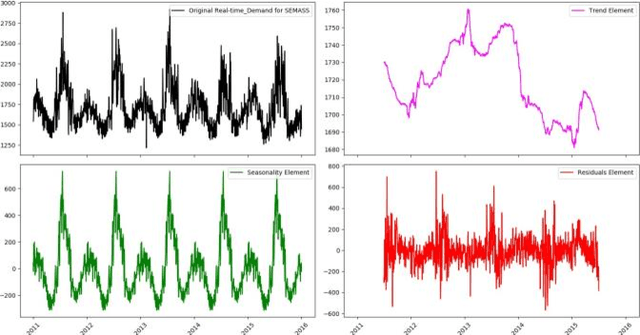
In this paper, in following of the first part (which ADF tests using ACI evaluation) has conducted, Time Series (TSs) are analyzed using decomposition analysis. In fact, TSs are composed of four components including trend (long term behavior or progression of series), cyclic component (non-periodic fluctuation behavior which are usually long term), seasonal component (periodic fluctuations due to seasonal variations like temperature, weather condition and etc.) and error term. For our case of cyber-attack detection, in this paper, two common ways of TS decomposition are investigated. The first method is additive decomposition and the second is multiplicative method to decompose a TS into its components. After decomposition, the error term is tested using Durbin-Watson and Breusch-Godfrey test to see whether the error follows any predictable pattern, it can be concluded that there is a chance of cyber-attack to the system.