 Add to Chrome
 Add to Firefox
 Add to Edge
Residual-Concatenate Neural Network with Deep Regularization Layers for Binary Classification
May 25, 2022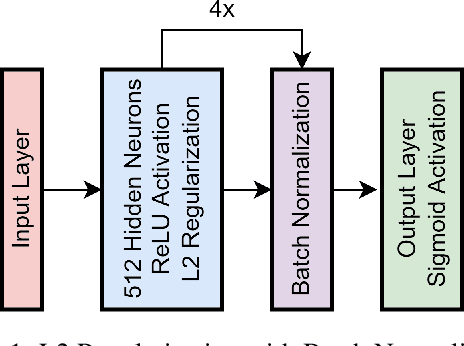
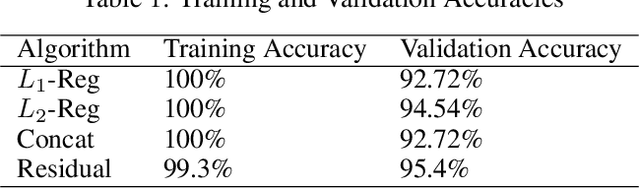
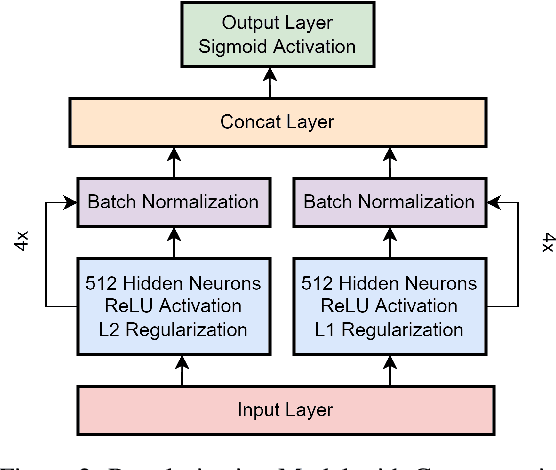
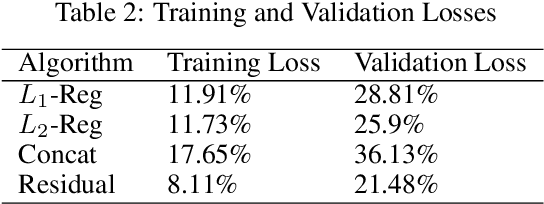
Many complex Deep Learning models are used with different variations for various prognostication tasks. The higher learning parameters not necessarily ensure great accuracy. This can be solved by considering changes in very deep models with many regularization based techniques. In this paper we train a deep neural network that uses many regularization layers with residual and concatenation process for best fit with Polycystic Ovary Syndrome Diagnosis prognostication. The network was built with improvements from every step of failure to meet the needs of the data and achieves an accuracy of 99.3% seamlessly.
Combining Varied Learners for Binary Classification using Stacked Generalization
Feb 17, 2022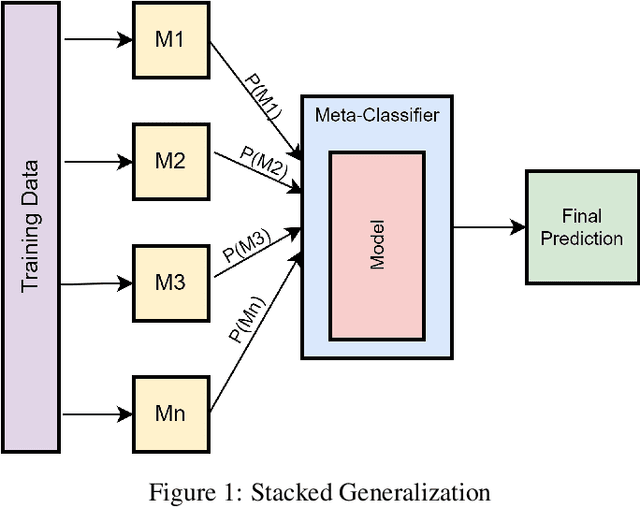
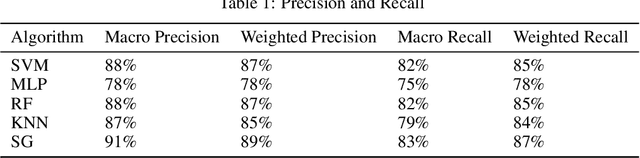
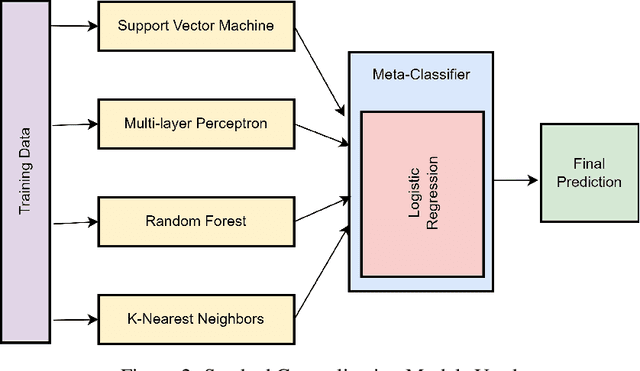
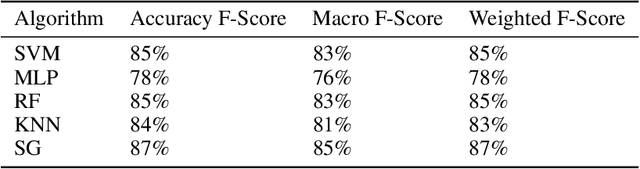
The Machine Learning has various learning algorithms that are better in some or the other aspect when compared with each other but a common error that all algorithms will suffer from is training data with very high dimensional feature set. This usually ends up algorithms into generalization error that deplete the performance. This can be solved using an Ensemble Learning method known as Stacking commonly termed as Stacked Generalization. In this paper we perform binary classification using Stacked Generalization on high dimensional Polycystic Ovary Syndrome dataset and prove the point that model becomes generalized and metrics improve significantly. The various metrics are given in this paper that also point out a subtle transgression found with Receiver Operating Characteristic Curve that was proved to be incorrect.
Effects of Parametric and Non-Parametric Methods on High Dimensional Sparse Matrix Representations
Feb 07, 2022The semantics are derived from textual data that provide representations for Machine Learning algorithms. These representations are interpretable form of high dimensional sparse matrix that are given as an input to the machine learning algorithms. Since learning methods are broadly classified as parametric and non-parametric learning methods, in this paper we provide the effects of these type of algorithms on the high dimensional sparse matrix representations. In order to derive the representations from the text data, we have considered TF-IDF representation with valid reason in the paper. We have formed representations of 50, 100, 500, 1000 and 5000 dimensions respectively over which we have performed classification using Linear Discriminant Analysis and Naive Bayes as parametric learning method, Decision Tree and Support Vector Machines as non-parametric learning method. We have later provided the metrics on every single dimension of the representation and effect of every single algorithm detailed in this paper.