 Add to Chrome
 Add to Firefox
 Add to Edge
Automated detection and quantification of COVID-19 airspace disease on chest radiographs: A novel approach achieving radiologist-level performance using a CNN trained on digital reconstructed radiographs (DRRs) from CT-based ground-truth
Aug 13, 2020


Purpose: To leverage volumetric quantification of airspace disease (AD) derived from a superior modality (CT) serving as ground truth, projected onto digitally reconstructed radiographs (DRRs) to: 1) train a convolutional neural network to quantify airspace disease on paired CXRs; and 2) compare the DRR-trained CNN to expert human readers in the CXR evaluation of patients with confirmed COVID-19. Materials and Methods: We retrospectively selected a cohort of 86 COVID-19 patients (with positive RT-PCR), from March-May 2020 at a tertiary hospital in the northeastern USA, who underwent chest CT and CXR within 48 hrs. The ground truth volumetric percentage of COVID-19 related AD (POv) was established by manual AD segmentation on CT. The resulting 3D masks were projected into 2D anterior-posterior digitally reconstructed radiographs (DRR) to compute area-based AD percentage (POa). A convolutional neural network (CNN) was trained with DRR images generated from a larger-scale CT dataset of COVID-19 and non-COVID-19 patients, automatically segmenting lungs, AD and quantifying POa on CXR. CNN POa results were compared to POa quantified on CXR by two expert readers and to the POv ground-truth, by computing correlations and mean absolute errors. Results: Bootstrap mean absolute error (MAE) and correlations between POa and POv were 11.98% [11.05%-12.47%] and 0.77 [0.70-0.82] for average of expert readers, and 9.56%-9.78% [8.83%-10.22%] and 0.78-0.81 [0.73-0.85] for the CNN, respectively. Conclusion: Our CNN trained with DRR using CT-derived airspace quantification achieved expert radiologist level of accuracy in the quantification of airspace disease on CXR, in patients with positive RT-PCR for COVID-19.
Machine Learning Automatically Detects COVID-19 using Chest CTs in a Large Multicenter Cohort
Jun 11, 2020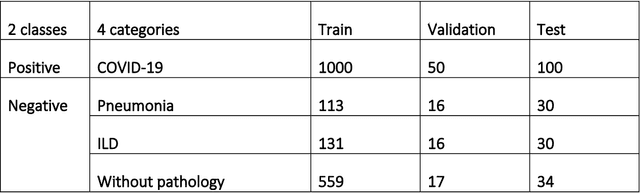
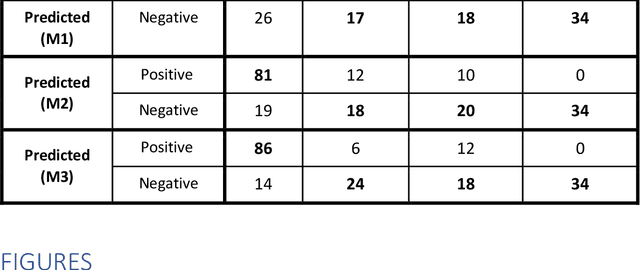
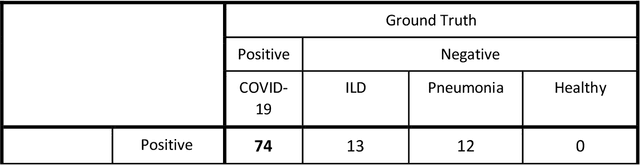
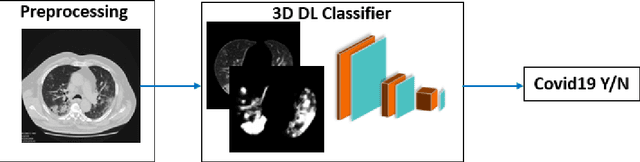
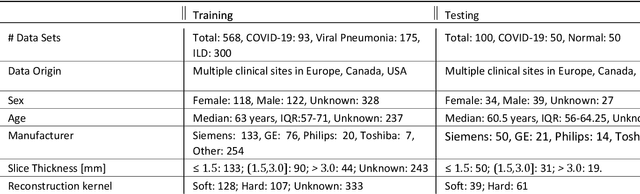
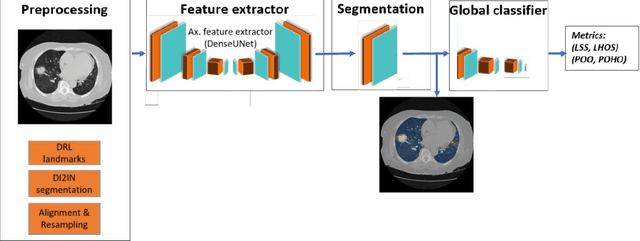
Purpose: To investigate if AI-based classifiers can distinguish COVID-19 from other pulmonary diseases and normal groups, using chest CT images. To study the interpretability of discriminative features for COVID19 detection. Materials and Methods: Our database consists of 2096 CT exams that include CTs from 1150 COVID-19 patients. Training was performed on 1000 COVID-19, 131 ILD, 113 other pneumonias, 559 normal CTs, and testing on 100 COVID-19, 30 ILD, 30 other pneumonias, and 34 normal CTs. A metric-based approach for classification of COVID-19 used interpretable features, relying on logistic regression and random forests. A deep learning-based classifier differentiated COVID-19 based on 3D features extracted directly from CT intensities and from the probability distribution of airspace opacities. Results: Most discriminative features of COVID-19 are percentage of airspace opacity, ground glass opacities, consolidations, and peripheral and basal opacities, which coincide with the typical characterization of COVID-19 in the literature. Unsupervised hierarchical clustering compares the distribution of these features across COVID-19 and control cohorts. The metrics-based classifier achieved AUC, sensitivity, and specificity of respectively 0.85, 0.81, and 0.77. The DL-based classifier achieved AUC, sensitivity, and specificity of respectively 0.90, 0.86, and 0.81. Most of ambiguity comes from non-COVID-19 pneumonia with manifestations that overlap with COVID-19, as well as COVID-19 cases in early stages. Conclusion: A new method discriminates COVID-19 from other types of pneumonia, ILD, and normal, using quantitative patterns from chest CT. Our models balance interpretability of results and classification performance, and therefore may be useful to expedite and improve diagnosis of COVID-19.
Quantification of Tomographic Patterns associated with COVID-19 from Chest CT
Apr 28, 2020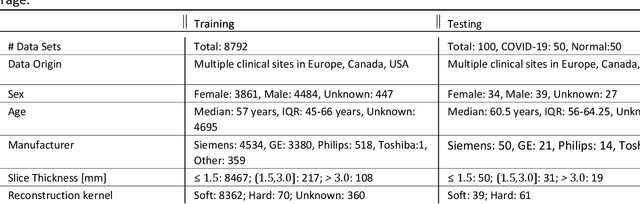
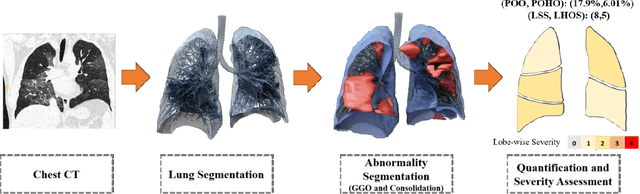
Purpose: To present a method that automatically detects and quantifies abnormal tomographic patterns commonly present in COVID-19, namely Ground Glass Opacities (GGO) and consolidations. Given that high opacity abnormalities (i.e., consolidations) were shown to correlate with severe disease, the paper introduces two combined severity measures (Percentage of Opacity, Percentage of High Opacity) and (Lung Severity Score, Lung High Opacity Score). They quantify the extent of overall COVID-19 abnormalities and the presence of high opacity abnormalities, global and lobe-wise, respectively, being computed based on 3D segmentations of lesions, lungs, and lobes. Materials and Methods: The proposed method takes as input a non-contrasted Chest CT and segments the lesions, lungs, and lobes in 3D. It outputs two combined measures of the severity of lung/lobe involvement, quantifying both the extent of COVID-19 abnormalities and presence of high opacities, based on deep learning and deep reinforcement learning. The first measure (POO, POHO) is global, while the second (LSS, LHOS) is lobe-wise. Evaluation is reported on CTs of 100 subjects (50 COVID-19 confirmed and 50 controls) from institutions from Canada, Europe and US. Ground truth is established by manual annotations of lesions, lungs, and lobes. Results: Pearson Correlation Coefficient between method prediction and ground truth is 0.97 (POO), 0.98 (POHO), 0.96 (LSS), 0.96 (LHOS). Automated processing time to compute the severity scores is 10 seconds/case vs 30 mins needed for manual annotations. Conclusion: A new method identifies regions of abnormalities seen in COVID-19 non-contrasted Chest CT and computes (POO, POHO) and (LSS, LHOS) severity scores.