 Add to Chrome
 Add to Firefox
 Add to Edge
Region-wise stacking ensembles for estimating brain-age using MRI
Jan 17, 2025


Predictive modeling using structural magnetic resonance imaging (MRI) data is a prominent approach to study brain-aging. Machine learning algorithms and feature extraction methods have been employed to improve predictions and explore healthy and accelerated aging e.g. neurodegenerative and psychiatric disorders. The high-dimensional MRI data pose challenges to building generalizable and interpretable models as well as for data privacy. Common practices are resampling or averaging voxels within predefined parcels, which reduces anatomical specificity and biological interpretability as voxels within a region may differently relate to aging. Effectively, naive fusion by averaging can result in information loss and reduced accuracy. We present a conceptually novel two-level stacking ensemble (SE) approach. The first level comprises regional models for predicting individuals' age based on voxel-wise information, fused by a second-level model yielding final predictions. Eight data fusion scenarios were explored using as input Gray matter volume (GMV) estimates from four datasets covering the adult lifespan. Performance, measured using mean absolute error (MAE), R2, correlation and prediction bias, showed that SE outperformed the region-wise averages. The best performance was obtained when first-level regional predictions were obtained as out-of-sample predictions on the application site with second-level models trained on independent and site-specific data (MAE=4.75 vs baseline regional mean GMV MAE=5.68). Performance improved as more datasets were used for training. First-level predictions showed improved and more robust aging signal providing new biological insights and enhanced data privacy. Overall, the SE improves accuracy compared to the baseline while preserving or enhancing data privacy.
The impact of MRI image quality on statistical and predictive analysis on voxel based morphology
Nov 02, 2024


Image Quality of MRI brain scans is strongly influenced by within scanner head movements and the resulting image artifacts alter derived measures like brain volume and cortical thickness. Automated image quality assessment is key to controlling for confounding effects of poor image quality. In this study, we systematically test for the influence of image quality on univariate statistics and machine learning classification. We analyzed group effects of sex/gender on local brain volume and made predictions of sex/gender using logistic regression, while correcting for brain size. From three large publicly available datasets, two age and sex-balanced samples were derived to test the generalizability of the effect for pooled sample sizes of n=760 and n=1094. Results of the Bonferroni corrected t-tests over 3747 gray matter features showed a strong influence of low-quality data on the ability to find significant sex/gender differences for the smaller sample. Increasing sample size and more so image quality showed a stark increase in detecting significant effects in univariate group comparisons. For the classification of sex/gender using logistic regression, both increasing sample size and image quality had a marginal effect on the Area under the Receiver Operating Characteristic Curve for most datasets and subsamples. Our results suggest a more stringent quality control for univariate approaches than for multivariate classification with a leaning towards higher quality for classical group statistics and bigger sample sizes for machine learning applications in neuroimaging.
Impact of Leakage on Data Harmonization in Machine Learning Pipelines in Class Imbalance Across Sites
Oct 25, 2024


Machine learning (ML) models benefit from large datasets. Collecting data in biomedical domains is costly and challenging, hence, combining datasets has become a common practice. However, datasets obtained under different conditions could present undesired site-specific variability. Data harmonization methods aim to remove site-specific variance while retaining biologically relevant information. This study evaluates the effectiveness of popularly used ComBat-based methods for harmonizing data in scenarios where the class balance is not equal across sites. We find that these methods struggle with data leakage issues. To overcome this problem, we propose a novel approach PrettYharmonize, designed to harmonize data by pretending the target labels. We validate our approach using controlled datasets designed to benchmark the utility of harmonization. Finally, using real-world MRI and clinical data, we compare leakage-prone methods with PrettYharmonize and show that it achieves comparable performance while avoiding data leakage, particularly in site-target-dependence scenarios.
On Leakage in Machine Learning Pipelines
Nov 07, 2023


Machine learning (ML) provides powerful tools for predictive modeling. ML's popularity stems from the promise of sample-level prediction with applications across a variety of fields from physics and marketing to healthcare. However, if not properly implemented and evaluated, ML pipelines may contain leakage typically resulting in overoptimistic performance estimates and failure to generalize to new data. This can have severe negative financial and societal implications. Our aim is to expand understanding associated with causes leading to leakage when designing, implementing, and evaluating ML pipelines. Illustrated by concrete examples, we provide a comprehensive overview and discussion of various types of leakage that may arise in ML pipelines.
Confound-leakage: Confound Removal in Machine Learning Leads to Leakage
Oct 17, 2022Machine learning (ML) approaches to data analysis are now widely adopted in many fields including epidemiology and medicine. To apply these approaches, confounds must first be removed as is commonly done by featurewise removal of their variance by linear regression before applying ML. Here, we show this common approach to confound removal biases ML models, leading to misleading results. Specifically, this common deconfounding approach can leak information such that what are null or moderate effects become amplified to near-perfect prediction when nonlinear ML approaches are subsequently applied. We identify and evaluate possible mechanisms for such confound-leakage and provide practical guidance to mitigate its negative impact. We demonstrate the real-world importance of confound-leakage by analyzing a clinical dataset where accuracy is overestimated for predicting attention deficit hyperactivity disorder (ADHD) with depression as a confound. Our results have wide-reaching implications for implementation and deployment of ML workflows and beg caution against na\"ive use of standard confound removal approaches.
Predictive Data Calibration for Linear Correlation Significance Testing
Aug 15, 2022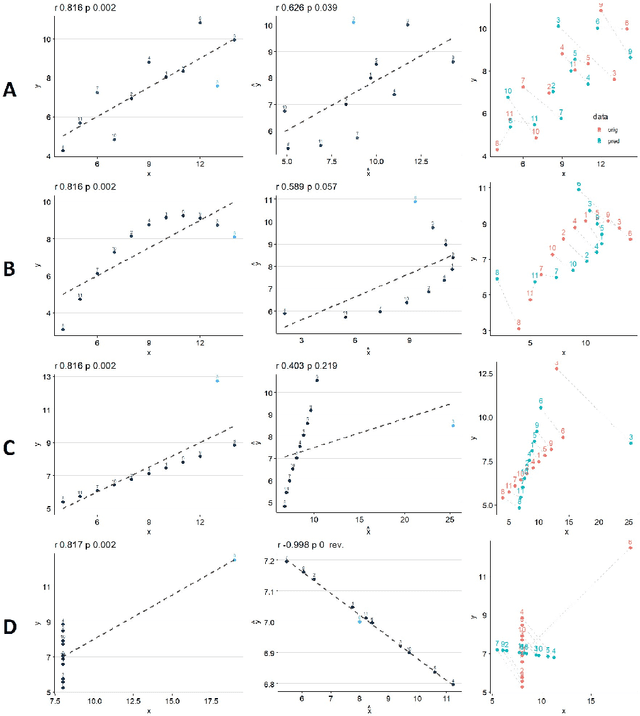

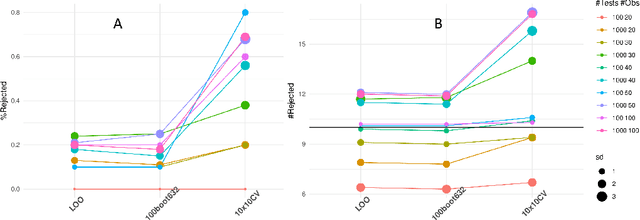
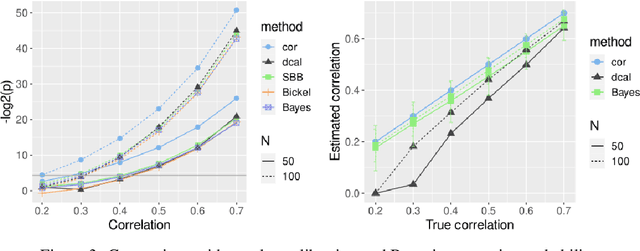
Inferring linear relationships lies at the heart of many empirical investigations. A measure of linear dependence should correctly evaluate the strength of the relationship as well as qualify whether it is meaningful for the population. Pearson's correlation coefficient (PCC), the \textit{de-facto} measure for bivariate relationships, is known to lack in both regards. The estimated strength $r$ maybe wrong due to limited sample size, and nonnormality of data. In the context of statistical significance testing, erroneous interpretation of a $p$-value as posterior probability leads to Type I errors -- a general issue with significance testing that extends to PCC. Such errors are exacerbated when testing multiple hypotheses simultaneously. To tackle these issues, we propose a machine-learning-based predictive data calibration method which essentially conditions the data samples on the expected linear relationship. Calculating PCC using calibrated data yields a calibrated $p$-value that can be interpreted as posterior probability together with a calibrated $r$ estimate, a desired outcome not provided by other methods. Furthermore, the ensuing independent interpretation of each test might eliminate the need for multiple testing correction. We provide empirical evidence favouring the proposed method using several simulations and application to real-world data.
Deep neural network heatmaps capture Alzheimer's disease patterns reported in a large meta-analysis of neuroimaging studies
Jul 22, 2022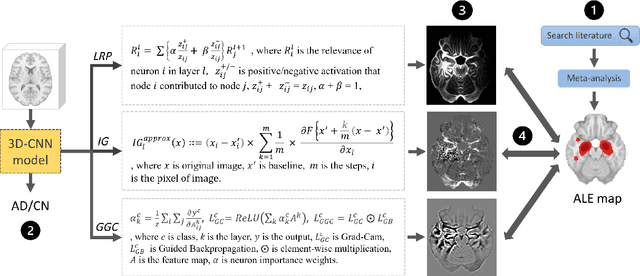
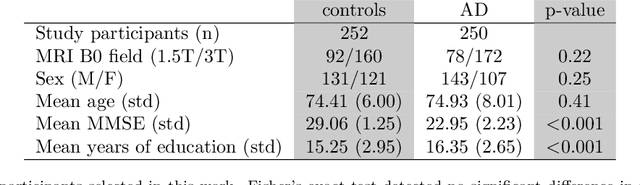
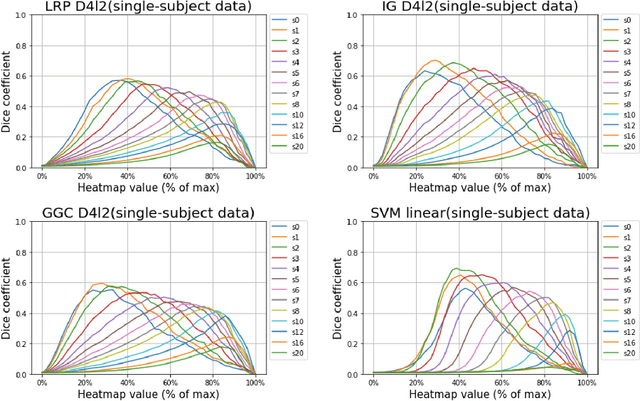
Deep neural networks currently provide the most advanced and accurate machine learning models to distinguish between structural MRI scans of subjects with Alzheimer's disease and healthy controls. Unfortunately, the subtle brain alterations captured by these models are difficult to interpret because of the complexity of these multi-layer and non-linear models. Several heatmap methods have been proposed to address this issue and analyze the imaging patterns extracted from the deep neural networks, but no quantitative comparison between these methods has been carried out so far. In this work, we explore these questions by deriving heatmaps from Convolutional Neural Networks (CNN) trained using T1 MRI scans of the ADNI data set, and by comparing these heatmaps with brain maps corresponding to Support Vector Machines (SVM) coefficients. Three prominent heatmap methods are studied: Layer-wise Relevance Propagation (LRP), Integrated Gradients (IG), and Guided Grad-CAM (GGC). Contrary to prior studies where the quality of heatmaps was visually or qualitatively assessed, we obtained precise quantitative measures by computing overlap with a ground-truth map from a large meta-analysis that combined 77 voxel-based morphometry (VBM) studies independently from ADNI. Our results indicate that all three heatmap methods were able to capture brain regions covering the meta-analysis map and achieved better results than SVM coefficients. Among them, IG produced the heatmaps with the best overlap with the independent meta-analysis.
Systematic Overestimation of Machine Learning Performance in Neuroimaging Studies of Depression
Dec 13, 2019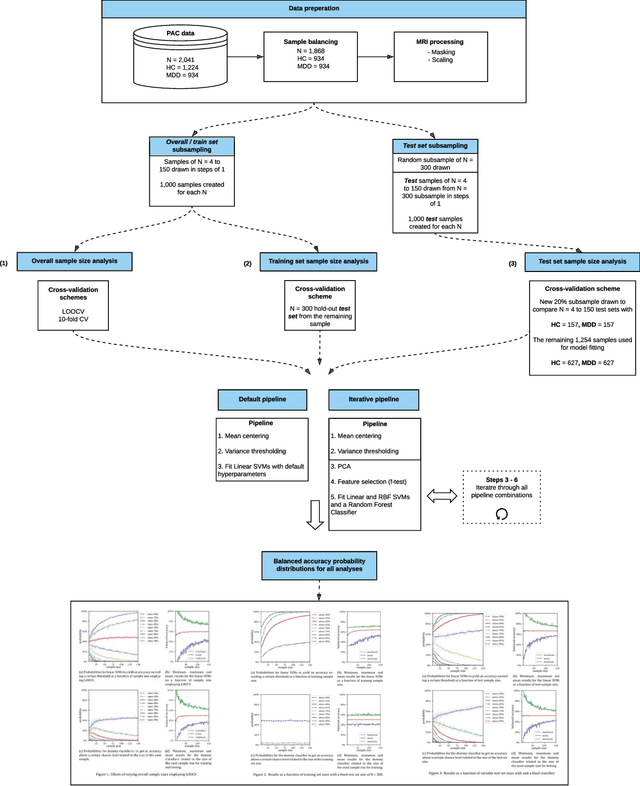
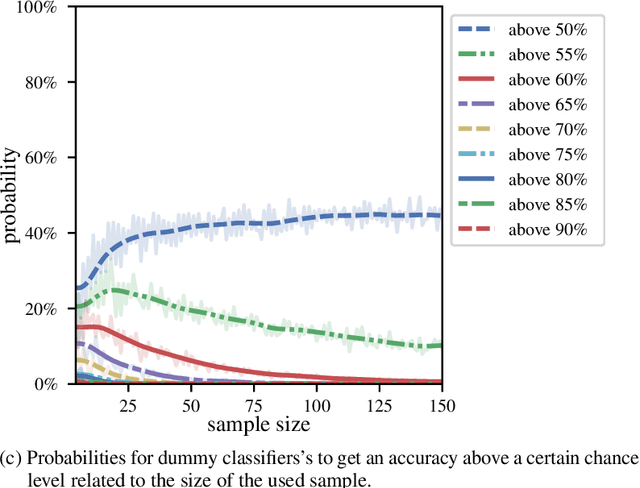
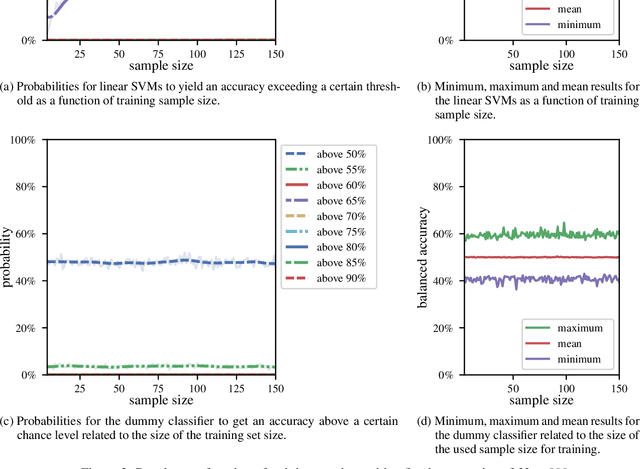
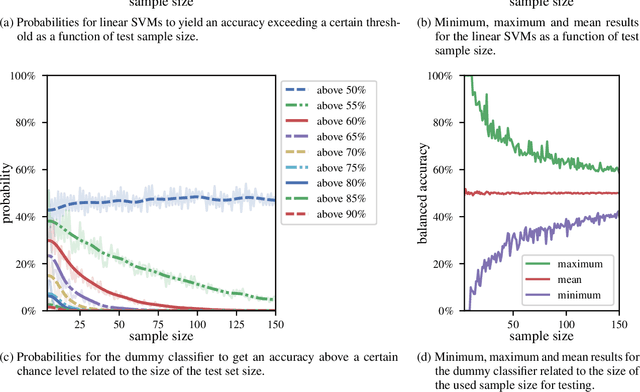
We currently observe a disconcerting phenomenon in machine learning studies in psychiatry: While we would expect larger samples to yield better results due to the availability of more data, larger machine learning studies consistently show much weaker performance than the numerous small-scale studies. Here, we systematically investigated this effect focusing on one of the most heavily studied questions in the field, namely the classification of patients suffering from Major Depressive Disorder (MDD) and healthy controls. Drawing upon a balanced sample of $N = 1,868$ MDD patients and healthy controls from our recent international Predictive Analytics Competition (PAC), we first trained and tested a classification model on the full dataset which yielded an accuracy of 61%. Next, we mimicked the process by which researchers would draw samples of various sizes ($N=4$ to $N=150$) from the population and showed a strong risk of overestimation. Specifically, for small sample sizes ($N=20$), we observe accuracies of up to 95%. For medium sample sizes ($N=100$) accuracies up to 75% were found. Importantly, further investigation showed that sufficiently large test sets effectively protect against performance overestimation whereas larger datasets per se do not. While these results question the validity of a substantial part of the current literature, we outline the relatively low-cost remedy of larger test sets.