 Add to Chrome
 Add to Firefox
 Add to Edge
ClimateViz: A Benchmark for Statistical Reasoning and Fact Verification on Scientific Charts
Jun 11, 2025Scientific fact-checking has mostly focused on text and tables, overlooking scientific charts, which are key for presenting quantitative evidence and statistical reasoning. We introduce ClimateViz, the first large-scale benchmark for scientific fact-checking using expert-curated scientific charts. ClimateViz contains 49,862 claims linked to 2,896 visualizations, each labeled as support, refute, or not enough information. To improve interpretability, each example includes structured knowledge graph explanations covering trends, comparisons, and causal relations. We evaluate state-of-the-art multimodal language models, including both proprietary and open-source systems, in zero-shot and few-shot settings. Results show that current models struggle with chart-based reasoning: even the best systems, such as Gemini 2.5 and InternVL 2.5, reach only 76.2 to 77.8 percent accuracy in label-only settings, far below human performance (89.3 and 92.7 percent). Explanation-augmented outputs improve performance in some models. We released our dataset and code alongside the paper.
Decoding Climate Disagreement: A Graph Neural Network-Based Approach to Understanding Social Media Dynamics
Jul 09, 2024

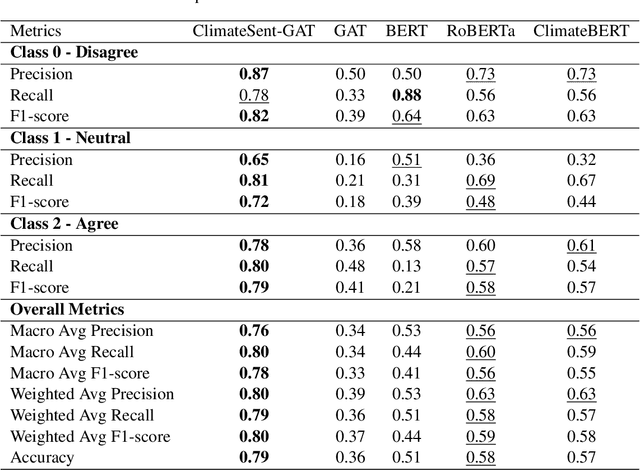

This work introduces the ClimateSent-GAT Model, an innovative method that integrates Graph Attention Networks (GATs) with techniques from natural language processing to accurately identify and predict disagreements within Reddit comment-reply pairs. Our model classifies disagreements into three categories: agree, disagree, and neutral. Leveraging the inherent graph structure of Reddit comment-reply pairs, the model significantly outperforms existing benchmarks by capturing complex interaction patterns and sentiment dynamics. This research advances graph-based NLP methodologies and provides actionable insights for policymakers and educators in climate science communication.