 Add to Chrome
 Add to Firefox
 Add to Edge
Bar-JEPA: Extracting Values from Bar Chart with Joint-Embedding Predictive Architecture
Aug 06, 2026
Bar charts are commonly used in data visualization, and while they are easily understood by humans, it is non-trivial to extract the underlying data computationally. For a machine-learning-based approach, training chart de-rendering models usually requires labeled, real-world data. Labeling data is a time consuming task, which is why annotated data is scarce. Models can learn more efficiently when provided with features of high semantic quality, which a joint-embedding predictive architecture (JEPA) is designed to learn in a self-supervised manner. We present a per-bar, numerical value recovery pipeline for bar charts, where a JEPA encoder is used to produce semantically rich latent features. The decoder model consuming these features is simple and quick to train and outputs the coordinates of ticks and bars, which can be used to recover bar values. The effectiveness of self-supervised finetuning and quality of the extracted features is evident when comparing our model to end-to-end supervised baselines. Code, datasets and checkpoints are available on \href{https://github.com/dralois/Bar-JEPA}{GitHub}.

PaCoNet: Deep Data Extraction for Parallel Coordinates
Aug 06, 2026Extracting data from visualizations has long challenged computer vision, with current research focused on bar, line, and pie charts, among other low-dimensional visualizations. However, parallel coordinates as a widely used high-dimensional data visualization approach, remain largely unexplored in this context. As parallel coordinate plots can quickly become cluttered and difficult to interpret when poorly designed or densely populated, automated data extraction from such visualizations is of particular interest. In this paper, we propose PaCoNet, the first approach for parallel coordinate data extraction. PaCoNet not only extracts line coordinates, but also enables the extraction of individual data samples for further analysis. Towards this end, we make the following contributions. We present the first deep learning approach tailored for parallel coordinate analysis, and demonstrate that it outperforms unadapted baselines by a significant margin. We further introduce a large-scale parallel coordinate dataset for training and testing. Together, these key contributions enable for the first time the automated analysis and redesign of parallel coordinate plots. PaCoNet thus lays the groundwork for complex visualization analysis, and further advances the intersection of computer vision and data visualization. All code, trained models, and data generation scripts will be made publicly available upon acceptance of the paper.
Evaluating Text-to-Image Synthesis: Survey and Taxonomy of Image Quality Metrics
Mar 29, 2024Recent advances in text-to-image synthesis enabled through a combination of language and vision foundation models have led to a proliferation of the tools available and an increased attention to the field. When conducting text-to-image synthesis, a central goal is to ensure that the content between text and image is aligned. As such, there exist numerous evaluation metrics that aim to mimic human judgement. However, it is often unclear which metric to use for evaluating text-to-image synthesis systems as their evaluation is highly nuanced. In this work, we provide a comprehensive overview of existing text-to-image evaluation metrics. Based on our findings, we propose a new taxonomy for categorizing these metrics. Our taxonomy is grounded in the assumption that there are two main quality criteria, namely compositionality and generality, which ideally map to human preferences. Ultimately, we derive guidelines for practitioners conducting text-to-image evaluation, discuss open challenges of evaluation mechanisms, and surface limitations of current metrics.
LLMMaps -- A Visual Metaphor for Stratified Evaluation of Large Language Models
Apr 02, 2023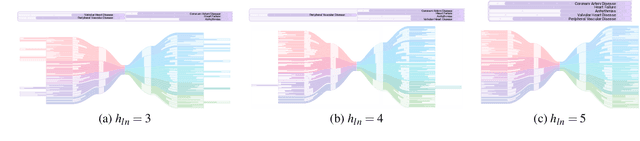
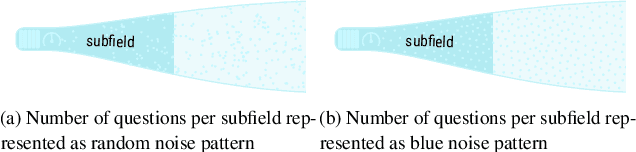
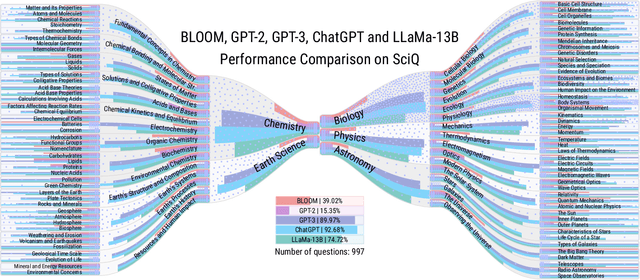
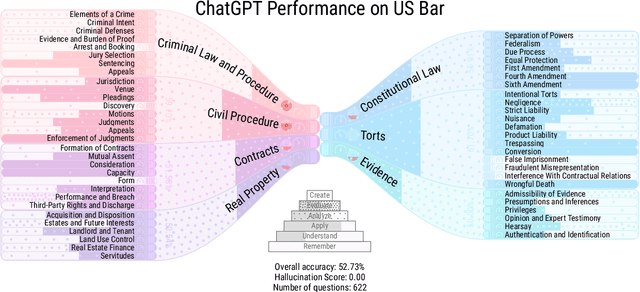
Large Language Models (LLMs) have revolutionized natural language processing and demonstrated impressive capabilities in various tasks. Unfortunately, they are prone to hallucinations, where the model exposes incorrect or false information in its responses, which renders diligent evaluation approaches mandatory. While LLM performance in specific knowledge fields is often evaluated based on question and answer (Q&A) datasets, such evaluations usually report only a single accuracy number for the entire field, a procedure which is problematic with respect to transparency and model improvement. A stratified evaluation could instead reveal subfields, where hallucinations are more likely to occur and thus help to better assess LLMs' risks and guide their further development. To support such stratified evaluations, we propose LLMMaps as a novel visualization technique that enables users to evaluate LLMs' performance with respect to Q&A datasets. LLMMaps provide detailed insights into LLMs' knowledge capabilities in different subfields, by transforming Q&A datasets as well as LLM responses into our internal knowledge structure. An extension for comparative visualization furthermore, allows for the detailed comparison of multiple LLMs. To assess LLMMaps we use them to conduct a comparative analysis of several state-of-the-art LLMs, such as BLOOM, GPT-2, GPT-3, ChatGPT and LLaMa-13B, as well as two qualitative user evaluations. All necessary source code and data for generating LLMMaps to be used in scientific publications and elsewhere will be available on GitHub.