 Add to Chrome
 Add to Firefox
 Add to Edge
Global Offshore Wind Infrastructure: Deployment and Operational Dynamics from Dense Sentinel-1 Time Series
Apr 22, 2026The offshore wind energy sector is expanding rapidly, increasing the need for independent, high-temporal-resolution monitoring of infrastructure deployment and operation at global scale. While Earth Observation based offshore wind infrastructure mapping has matured for spatial localization, existing open datasets lack temporally dense and semantically fine-grained information on construction and operational dynamics. We introduce a global Sentinel-1 synthetic aperture radar (SAR) time series data corpus that resolves deployment and operational phases of offshore wind infrastructure from 2016Q1 to 2025Q1. Building on an updated object detection workflow, we compile 15,606 time series at detected infrastructure locations, with overall 14,840,637 events as analysis-ready 1D SAR backscatter profiles, one profile per Sentinel-1 acquisition and location. To enable direct use and benchmarking, we release (i) the analysis ready 1D SAR profiles, (ii) event-level baseline semantic labels generated by a rule-based classifier, and (iii) an expert-annotated benchmark dataset of 553 time series with 328,657 event labels. The baseline classifier achieves a macro F1 score of 0.84 in event-wise evaluation and an area under the collapsed edit similarity-quality threshold curve (AUC) of 0.785, indicating temporal coherence. We demonstrate that the resulting corpus supports global-scale analyses of deployment dynamics, the identification of differences in regional deployment patterns, vessel interactions, and operational events, and provides a reference for developing and comparing time series classification methods for offshore wind infrastructure monitoring.
Offshore oil and gas platform dynamics in the North Sea, Gulf of Mexico, and Persian Gulf: Exploiting the Sentinel-1 archive
Mar 20, 2026The increasing use of marine spaces by offshore infrastructure, including oil and gas platforms, underscores the need for consistent, scalable monitoring. Offshore development has economic, environmental, and regulatory implications, yet maritime areas remain difficult to monitor systematically due to their inaccessibility and spatial extent. This study presents an automated approach to the spatiotemporal detection of offshore oil and gas platforms based on freely available Earth observation data. Leveraging Sentinel-1 archive data and deep learning-based object detection, a consistent quarterly time series of platform locations for three major production regions: the North Sea, the Gulf of Mexico, and the Persian Gulf, was created for the period 2017-2025. In addition, platform size, water depth, distance to the coast, national affiliation, and installation and decommissioning dates were derived. 3,728 offshore platforms were identified in 2025, 356 in the North Sea, 1,641 in the Gulf of Mexico, and 1,731 in the Persian Gulf. While expansion was observed in the Persian Gulf until 2024, the Gulf of Mexico and the North Sea saw a decline in platform numbers from 2018-2020. At the same time, a pronounced dynamic was apparent. More than 2,700 platforms were installed or relocated to new sites, while a comparable number were decommissioned or relocated. Furthermore, the increasing number of platforms with short lifespans points to a structural change in the offshore sector associated with the growing importance of mobile offshore units such as jack-ups or drillships. The results highlighted the potential of freely available Earth observation data and deep learning for consistent, long-term monitoring of marine infrastructure. The derived dataset is public and provides a basis for offshore monitoring, maritime planning, and analyses of the transformation of the offshore energy sector.
Outlining where humans live -- The World Settlement Footprint 2015
Oct 28, 2019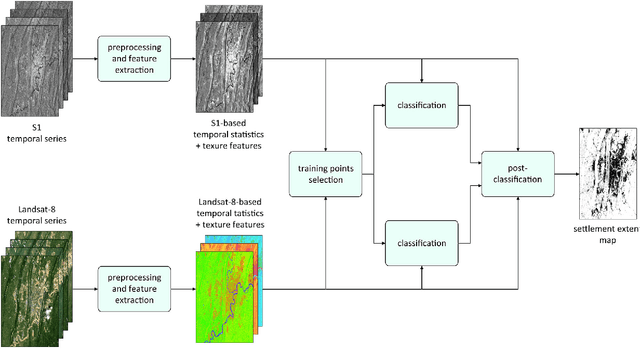
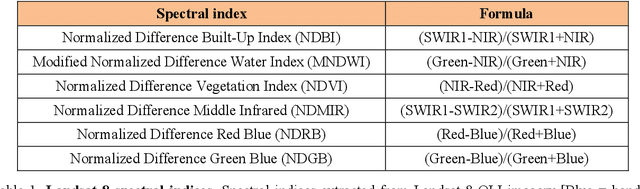
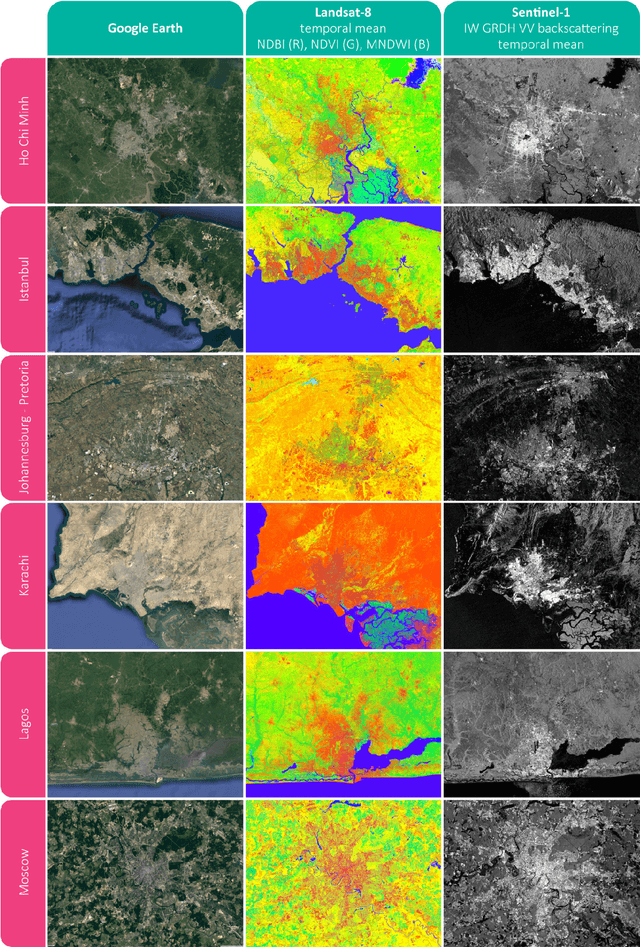
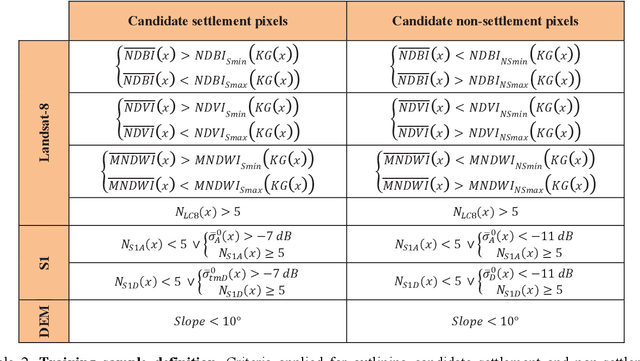
Human settlements are the cause and consequence of most environmental and societal changes on Earth; however, their location and extent is still under debate. We provide here a new 10m resolution (0.32 arc sec) global map of human settlements on Earth for the year 2015, namely the World Settlement Footprint 2015 (WSF2015). The raster dataset has been generated by means of an advanced classification system which, for the first time, jointly exploits open-and-free optical and radar satellite imagery. The WSF2015 has been validated against 900,000 samples labelled by crowdsourcing photointerpretation of very high resolution Google Earth imagery and outperforms all other similar existing layers; in particular, it considerably improves the detection of very small settlements in rural regions and better outlines scattered suburban areas. The dataset can be used at any scale of observation in support to all applications requiring detailed and accurate information on human presence (e.g., socioeconomic development, population distribution, risks assessment, etc.).