 Add to Chrome
 Add to Firefox
 Add to Edge
KidSat: satellite imagery to map childhood poverty dataset and benchmark
Jul 08, 2024


Satellite imagery has emerged as an important tool to analyse demographic, health, and development indicators. While various deep learning models have been built for these tasks, each is specific to a particular problem, with few standard benchmarks available. We propose a new dataset pairing satellite imagery and high-quality survey data on child poverty to benchmark satellite feature representations. Our dataset consists of 33,608 images, each 10 km $\times$ 10 km, from 19 countries in Eastern and Southern Africa in the time period 1997-2022. As defined by UNICEF, multidimensional child poverty covers six dimensions and it can be calculated from the face-to-face Demographic and Health Surveys (DHS) Program . As part of the benchmark, we test spatial as well as temporal generalization, by testing on unseen locations, and on data after the training years. Using our dataset we benchmark multiple models, from low-level satellite imagery models such as MOSAIKS , to deep learning foundation models, which include both generic vision models such as Self-Distillation with no Labels (DINOv2) models and specific satellite imagery models such as SatMAE. We provide open source code for building the satellite dataset, obtaining ground truth data from DHS and running various models assessed in our work.
Self-supervised learning unveils change in urban housing from street-level images
Sep 21, 2023


Cities around the world face a critical shortage of affordable and decent housing. Despite its critical importance for policy, our ability to effectively monitor and track progress in urban housing is limited. Deep learning-based computer vision methods applied to street-level images have been successful in the measurement of socioeconomic and environmental inequalities but did not fully utilize temporal images to track urban change as time-varying labels are often unavailable. We used self-supervised methods to measure change in London using 15 million street images taken between 2008 and 2021. Our novel adaptation of Barlow Twins, Street2Vec, embeds urban structure while being invariant to seasonal and daily changes without manual annotations. It outperformed generic embeddings, successfully identified point-level change in London's housing supply from street-level images, and distinguished between major and minor change. This capability can provide timely information for urban planning and policy decisions toward more liveable, equitable, and sustainable cities.
Deep Transfer Learning on Satellite Imagery Improves Air Quality Estimates in Developing Nations
Feb 17, 2022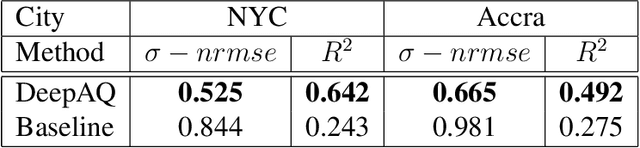
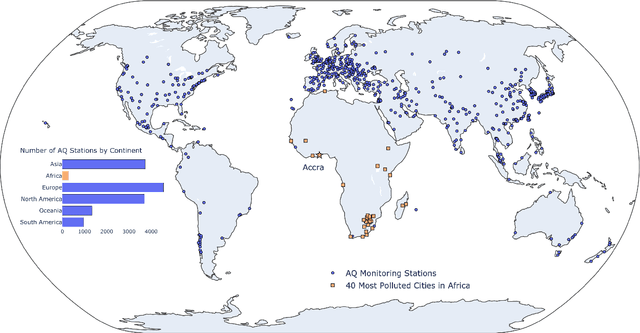
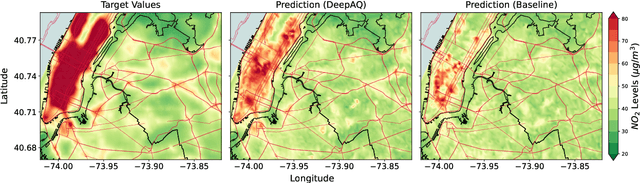
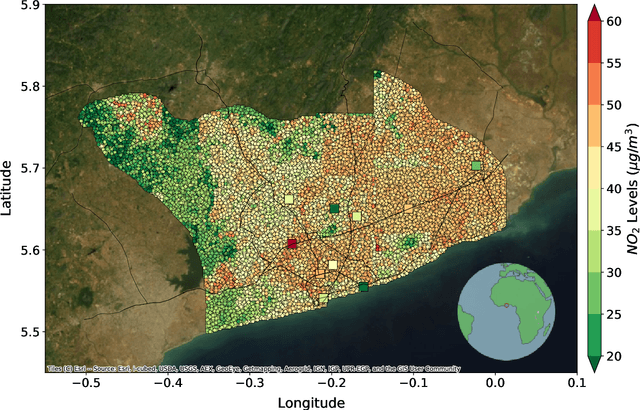
Urban air pollution is a public health challenge in low- and middle-income countries (LMICs). However, LMICs lack adequate air quality (AQ) monitoring infrastructure. A persistent challenge has been our inability to estimate AQ accurately in LMIC cities, which hinders emergency preparedness and risk mitigation. Deep learning-based models that map satellite imagery to AQ can be built for high-income countries (HICs) with adequate ground data. Here we demonstrate that a scalable approach that adapts deep transfer learning on satellite imagery for AQ can extract meaningful estimates and insights in LMIC cities based on spatiotemporal patterns learned in HIC cities. The approach is demonstrated for Accra in Ghana, Africa, with AQ patterns learned from two US cities, specifically Los Angeles and New York.
PCACE: A Statistical Approach to Ranking Neurons for CNN Interpretability
Dec 31, 2021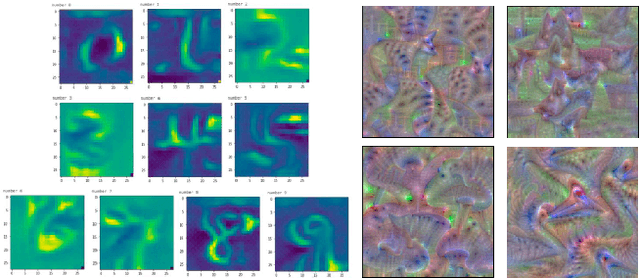
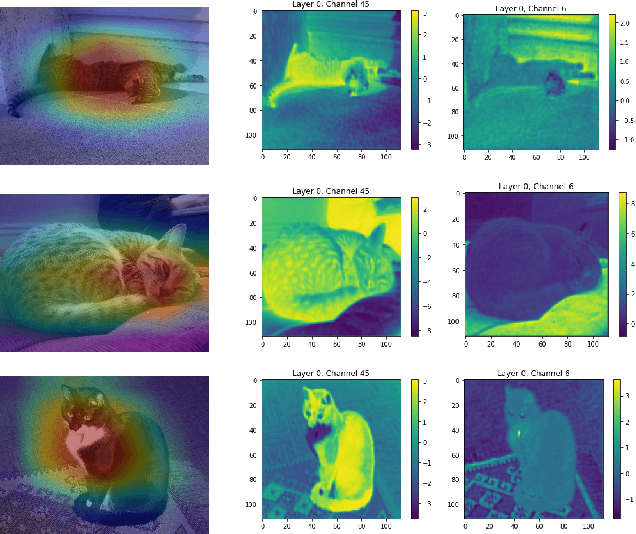
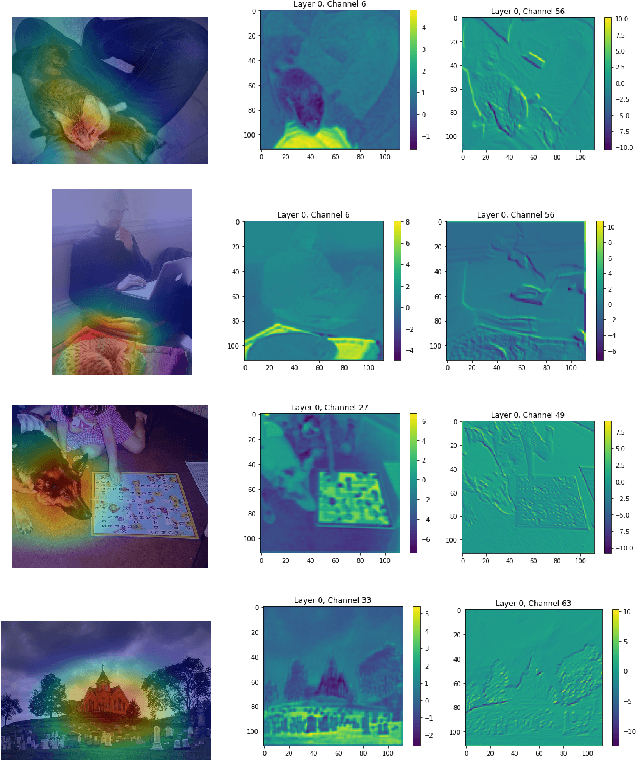
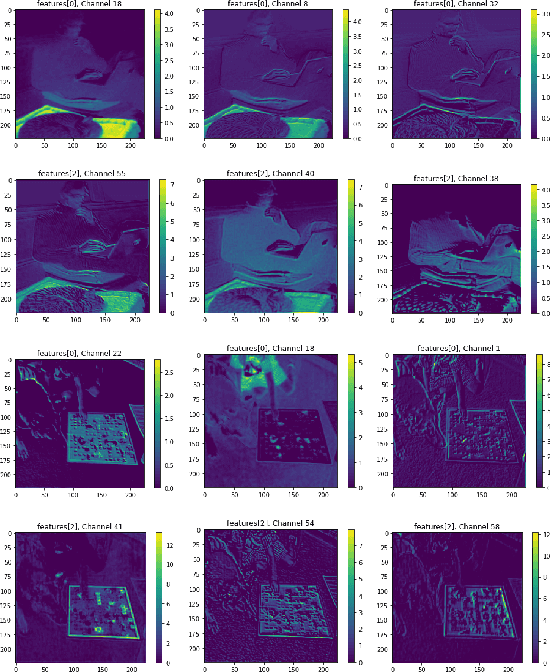
In this paper we introduce a new problem within the growing literature of interpretability for convolution neural networks (CNNs). While previous work has focused on the question of how to visually interpret CNNs, we ask what it is that we care to interpret, that is, which layers and neurons are worth our attention? Due to the vast size of modern deep learning network architectures, automated, quantitative methods are needed to rank the relative importance of neurons so as to provide an answer to this question. We present a new statistical method for ranking the hidden neurons in any convolutional layer of a network. We define importance as the maximal correlation between the activation maps and the class score. We provide different ways in which this method can be used for visualization purposes with MNIST and ImageNet, and show a real-world application of our method to air pollution prediction with street-level images.