 Add to Chrome
 Add to Firefox
 Add to Edge
A PubMed-Scale Dataset of Structured Biomedical Abstracts
Jun 09, 2026Structured abstracts are important for biomedical literature processing, by facilitating information retrieval, text mining, and knowledge synthesis. However, a vast portion of abstracts indexed in PubMed remain unstructured, presenting a significant bottleneck for downstream text-processing workflows and applications. To resolve this limitation, we introduce Structured PubMed, a comprehensive corpus of section-labeled biomedical abstracts compiled from the complete PubMed database, encompassing over 23.2 million research-article records. The corpus is divided into two distinct subsets: a collection of 5.9 million author-structured abstracts parsed from official XML files, and an automatically labeled collection of 17.2 million originally unstructured abstracts structured via a verbatim-extraction Large Language Model pipeline. Every record is harmonized under a unified five-section schema and mapped to its original PubMed identifier, publication type, and publication date. This dataset can be utilized to train sentence-classification models, benchmark text-segmentation architectures, and perform large-scale, section-specific information extraction at an unprecedented PubMed-wide scale.
IRIS: time-structured manifold projections
May 29, 2026High-dimensional biomedical data, such as cell-by-gene matrices, are increasingly generated temporally. However, Manifold Learning algorithms, like t-SNE and UMAP, cannot incorporate time-ordering in their layouts, obfuscating the dynamics of cell types or other classes. As a solution, we present IRIS, a new Manifold Learning algorithm that structures layouts both chronologically and by manifold topology. IRIS can visualize a wide range of dynamic biomedical data, including scRNA-seq, comparative metagenomics, and literature.
MedViz: An Agent-based, Visual-guided Research Assistant for Navigating Biomedical Literature
Jan 28, 2026Biomedical researchers face increasing challenges in navigating millions of publications in diverse domains. Traditional search engines typically return articles as ranked text lists, offering little support for global exploration or in-depth analysis. Although recent advances in generative AI and large language models have shown promise in tasks such as summarization, extraction, and question answering, their dialog-based implementations are poorly integrated with literature search workflows. To address this gap, we introduce MedViz, a visual analytics system that integrates multiple AI agents with interactive visualization to support the exploration of the large-scale biomedical literature. MedViz combines a semantic map of millions of articles with agent-driven functions for querying, summarizing, and hypothesis generation, allowing researchers to iteratively refine questions, identify trends, and uncover hidden connections. By bridging intelligent agents with interactive visualization, MedViz transforms biomedical literature search into a dynamic, exploratory process that accelerates knowledge discovery.
ctELM: Decoding and Manipulating Embeddings of Clinical Trials with Embedding Language Models
Jan 26, 2026Text embeddings have become an essential part of a variety of language applications. However, methods for interpreting, exploring and reversing embedding spaces are limited, reducing transparency and precluding potentially valuable generative use cases. In this work, we align Large Language Models to embeddings of clinical trials using the recently reported Embedding Language Model (ELM) method. We develop an open-source, domain-agnostic ELM architecture and training framework, design training tasks for clinical trials, and introduce an expert-validated synthetic dataset. We then train a series of ELMs exploring the impact of tasks and training regimes. Our final model, ctELM, can accurately describe and compare unseen clinical trials from embeddings alone and produce plausible clinical trials from novel vectors. We further show that generated trial abstracts are responsive to moving embeddings along concept vectors for age and sex of study subjects. Our public ELM implementation and experimental results will aid the alignment of Large Language Models to embedding spaces in the biomedical domain and beyond.
Lessons from the TREC Plain Language Adaptation of Biomedical Abstracts (PLABA) track
Jul 18, 2025
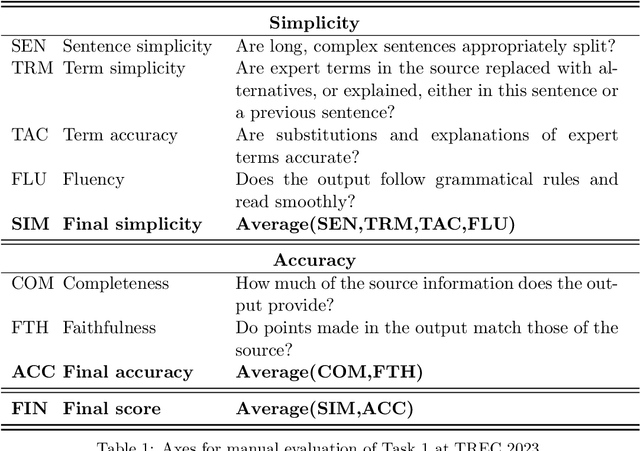
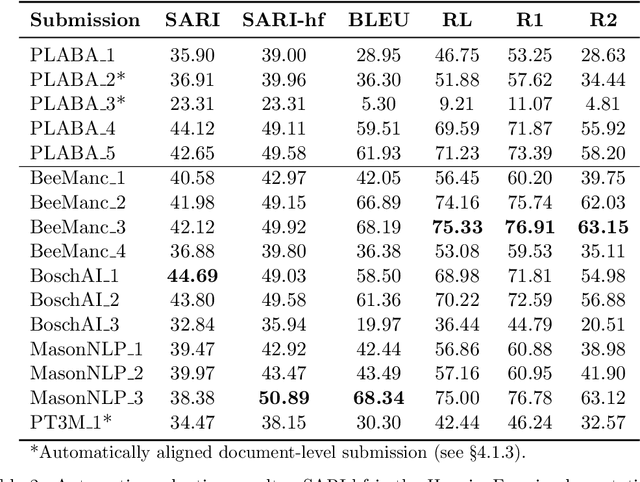
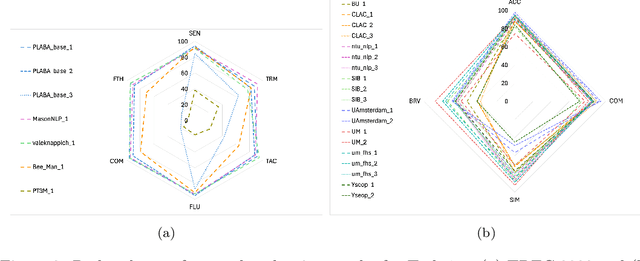
Objective: Recent advances in language models have shown potential to adapt professional-facing biomedical literature to plain language, making it accessible to patients and caregivers. However, their unpredictability, combined with the high potential for harm in this domain, means rigorous evaluation is necessary. Our goals with this track were to stimulate research and to provide high-quality evaluation of the most promising systems. Methods: We hosted the Plain Language Adaptation of Biomedical Abstracts (PLABA) track at the 2023 and 2024 Text Retrieval Conferences. Tasks included complete, sentence-level, rewriting of abstracts (Task 1) as well as identifying and replacing difficult terms (Task 2). For automatic evaluation of Task 1, we developed a four-fold set of professionally-written references. Submissions for both Tasks 1 and 2 were provided extensive manual evaluation from biomedical experts. Results: Twelve teams spanning twelve countries participated in the track, with models from multilayer perceptrons to large pretrained transformers. In manual judgments of Task 1, top-performing models rivaled human levels of factual accuracy and completeness, but not simplicity or brevity. Automatic, reference-based metrics generally did not correlate well with manual judgments. In Task 2, systems struggled with identifying difficult terms and classifying how to replace them. When generating replacements, however, LLM-based systems did well in manually judged accuracy, completeness, and simplicity, though not in brevity. Conclusion: The PLABA track showed promise for using Large Language Models to adapt biomedical literature for the general public, while also highlighting their deficiencies and the need for improved automatic benchmarking tools.
JEBS: A Fine-grained Biomedical Lexical Simplification Task
Jun 15, 2025


Online medical literature has made health information more available than ever, however, the barrier of complex medical jargon prevents the general public from understanding it. Though parallel and comparable corpora for Biomedical Text Simplification have been introduced, these conflate the many syntactic and lexical operations involved in simplification. To enable more targeted development and evaluation, we present a fine-grained lexical simplification task and dataset, Jargon Explanations for Biomedical Simplification (JEBS, https://github.com/bill-from-ri/JEBS-data ). The JEBS task involves identifying complex terms, classifying how to replace them, and generating replacement text. The JEBS dataset contains 21,595 replacements for 10,314 terms across 400 biomedical abstracts and their manually simplified versions. Additionally, we provide baseline results for a variety of rule-based and transformer-based systems for the three sub-tasks. The JEBS task, data, and baseline results pave the way for development and rigorous evaluation of systems for replacing or explaining complex biomedical terms.
CoronaViz: Visualizing Multilayer Spatiotemporal COVID-19 Data with Animated Geocircles
Nov 10, 2022


While many dashboards for visualizing COVID-19 data exist, most separate geospatial and temporal data into discrete visualizations or tables. Further, the common use of choropleth maps or space-filling map overlays supports only a single geospatial variable at once, making it difficult to compare the temporal and geospatial trends of multiple, potentially interacting variables, such as active cases, deaths, and vaccinations. We present CoronaViz, a COVID-19 visualization system that conveys multilayer, spatiotemporal data in a single, interactive display. CoronaViz encodes variables with concentric, hollow circles, termed geocircles, allowing multiple variables via color encoding and avoiding occlusion problems. The radii of geocircles relate to the values of the variables they represent via the psychophysically determined Flannery formula. The time dimension of spatiotemporal variables is encoded with sequential rendering. Animation controls allow the user to seek through time manually or to view the pandemic unfolding in accelerated time. An adjustable time window allows aggregation at any granularity, from single days to cumulative values for the entire available range. In addition to describing the CoronaViz system, we report findings from a user study comparing CoronaViz with multi-view dashboards from the New York Times and Johns Hopkins University. While participants preferred using the latter two dashboards to perform queries with only a geospatial component or only a temporal component, participants uniformly preferred CoronaViz for queries with both spatial and temporal components, highlighting the utility of a unified spatiotemporal encoding. CoronaViz is open-source and freely available at http://coronaviz.umiacs.io.