 Add to Chrome
 Add to Firefox
 Add to Edge
VizCV: AI-assisted visualization of researchers' publications tracks
May 13, 2025


Analyzing how the publication records of scientists and research groups have evolved over the years is crucial for assessing their expertise since it can support the management of academic environments by assisting with career planning and evaluation. We introduce VizCV, a novel web-based end-to-end visual analytics framework that enables the interactive exploration of researchers' scientific trajectories. It incorporates AI-assisted analysis and supports automated reporting of career evolution. Our system aims to model career progression through three key dimensions: a) research topic evolution to detect and visualize shifts in scholarly focus over time, b) publication record and the corresponding impact, c) collaboration dynamics depicting the growth and transformation of a researcher's co-authorship network. AI-driven insights provide automated explanations of career transitions, detecting significant shifts in research direction, impact surges, or collaboration expansions. The system also supports comparative analysis between researchers, allowing users to compare topic trajectories and impact growth. Our interactive, multi-tab and multiview system allows for the exploratory analysis of career milestones under different perspectives, such as the most impactful articles, emerging research themes, or obtaining a detailed analysis of the contribution of the researcher in a subfield. The key contributions include AI/ML techniques for: a) topic analysis, b) dimensionality reduction for visualizing patterns and trends, c) the interactive creation of textual descriptions of facets of data through configurable prompt generation and large language models, that include key indicators, to help understanding the career development of individuals or groups.
The Language of Infographics: Toward Understanding Conceptual Metaphor Use in Scientific Storytelling
Jul 18, 2024We apply an approach from cognitive linguistics by mapping Conceptual Metaphor Theory (CMT) to the visualization domain to address patterns of visual conceptual metaphors that are often used in science infographics. Metaphors play an essential part in visual communication and are frequently employed to explain complex concepts. However, their use is often based on intuition, rather than following a formal process. At present, we lack tools and language for understanding and describing metaphor use in visualization to the extent where taxonomy and grammar could guide the creation of visual components, e.g., infographics. Our classification of the visual conceptual mappings within scientific representations is based on the breakdown of visual components in existing scientific infographics. We demonstrate the development of this mapping through a detailed analysis of data collected from four domains (biomedicine, climate, space, and anthropology) that represent a diverse range of visual conceptual metaphors used in the visual communication of science. This work allows us to identify patterns of visual conceptual metaphor use within the domains, resolve ambiguities about why specific conceptual metaphors are used, and develop a better overall understanding of visual metaphor use in scientific infographics. Our analysis shows that ontological and orientational conceptual metaphors are the most widely applied to translate complex scientific concepts. To support our findings we developed a visual exploratory tool based on the collected database that places the individual infographics on a spatio-temporal scale and illustrates the breakdown of visual conceptual metaphors.
ProteiNN: Intrinsic-Extrinsic Convolution and Pooling for Scalable Deep Protein Analysis
Jul 13, 2020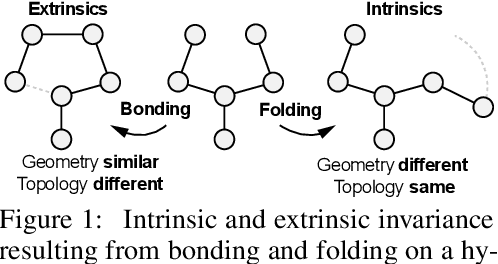
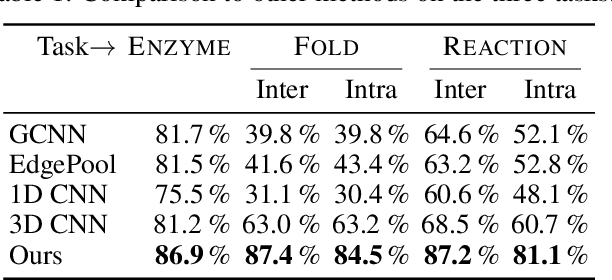
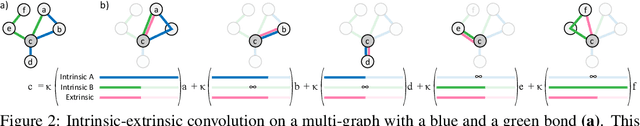
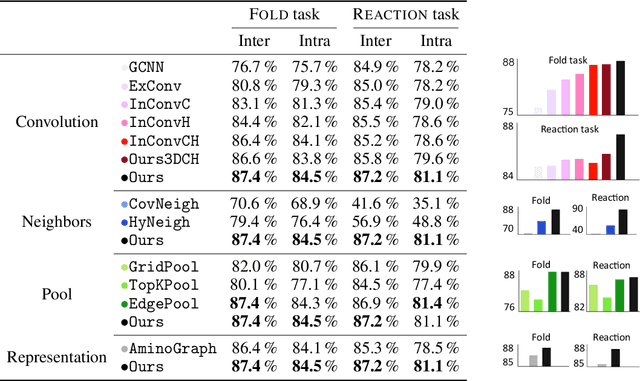
Proteins perform a large variety of functions in living organisms, thus playing a key role in biology. As of now, available learning algorithms to process protein data do not consider several particularities of such data and/or do not scale well for large protein conformations. To fill this gap, we propose two new learning operations enabling deep 3D analysis of large-scale protein data. First, we introduce a novel convolution operator which considers both, the intrinsic (invariant under protein folding) as well as extrinsic (invariant under bonding) structure, by using $n$-D convolutions defined on both the Euclidean distance, as well as multiple geodesic distances between atoms in a multi-graph. Second, we enable a multi-scale protein analysis by introducing hierarchical pooling operators, exploiting the fact that proteins are a recombination of a finite set of amino acids, which can be pooled using shared pooling matrices. Lastly, we evaluate the accuracy of our algorithms on several large-scale data sets for common protein analysis tasks, where we outperform state-of-the-art methods.