 Add to Chrome
 Add to Firefox
 Add to Edge
The Effect of Perceptual Metrics on Music Representation Learning for Genre Classification
Sep 25, 2024


The subjective quality of natural signals can be approximated with objective perceptual metrics. Designed to approximate the perceptual behaviour of human observers, perceptual metrics often reflect structures found in natural signals and neurological pathways. Models trained with perceptual metrics as loss functions can capture perceptually meaningful features from the structures held within these metrics. We demonstrate that using features extracted from autoencoders trained with perceptual losses can improve performance on music understanding tasks, i.e. genre classification, over using these metrics directly as distances when learning a classifier. This result suggests improved generalisation to novel signals when using perceptual metrics as loss functions for representation learning.
Learning Confidence Bounds for Classification with Imbalanced Data
Jul 16, 2024


Class imbalance poses a significant challenge in classification tasks, where traditional approaches often lead to biased models and unreliable predictions. Undersampling and oversampling techniques have been commonly employed to address this issue, yet they suffer from inherent limitations stemming from their simplistic approach such as loss of information and additional biases respectively. In this paper, we propose a novel framework that leverages learning theory and concentration inequalities to overcome the shortcomings of traditional solutions. We focus on understanding the uncertainty in a class-dependent manner, as captured by confidence bounds that we directly embed into the learning process. By incorporating class-dependent estimates, our method can effectively adapt to the varying degrees of imbalance across different classes, resulting in more robust and reliable classification outcomes. We empirically show how our framework provides a promising direction for handling imbalanced data in classification tasks, offering practitioners a valuable tool for building more accurate and trustworthy models.
An Interactive Human-Machine Learning Interface for Collecting and Learning from Complex Annotations
Mar 28, 2024Human-Computer Interaction has been shown to lead to improvements in machine learning systems by boosting model performance, accelerating learning and building user confidence. In this work, we aim to alleviate the expectation that human annotators adapt to the constraints imposed by traditional labels by allowing for extra flexibility in the form that supervision information is collected. For this, we propose a human-machine learning interface for binary classification tasks which enables human annotators to utilise counterfactual examples to complement standard binary labels as annotations for a dataset. Finally we discuss the challenges in future extensions of this work.
Evaluating Perceptual Distances by Fitting Binomial Distributions to Two-Alternative Forced Choice Data
Mar 15, 2024


The two-alternative forced choice (2AFC) experimental setup is popular in the visual perception literature, where practitioners aim to understand how human observers perceive distances within triplets that consist of a reference image and two distorted versions of that image. In the past, this had been conducted in controlled environments, with a tournament-style algorithm dictating which images are shown to each participant to rank the distorted images. Recently, crowd-sourced perceptual datasets have emerged, with no images shared between triplets, making ranking impossible. Evaluating perceptual distances using this data is non-trivial, relying on reducing the collection of judgements on a triplet to a binary decision -- which is suboptimal and prone to misleading conclusions. Instead, we statistically model the underlying decision-making process during 2AFC experiments using a binomial distribution. We use maximum likelihood estimation to fit a distribution to the perceptual judgements, conditioned on the perceptual distance to test and impose consistency and smoothness between our empirical estimates of the density. This way, we can evaluate a different number of judgements per triplet, and can calculate metrics such as likelihoods of judgements according to a set of distances -- key ingredients that neural network counterparts lack.
Data is Overrated: Perceptual Metrics Can Lead Learning in the Absence of Training Data
Dec 06, 2023

Perceptual metrics are traditionally used to evaluate the quality of natural signals, such as images and audio. They are designed to mimic the perceptual behaviour of human observers and usually reflect structures found in natural signals. This motivates their use as loss functions for training generative models such that models will learn to capture the structure held in the metric. We take this idea to the extreme in the audio domain by training a compressive autoencoder to reconstruct uniform noise, in lieu of natural data. We show that training with perceptual losses improves the reconstruction of spectrograms and re-synthesized audio at test time over models trained with a standard Euclidean loss. This demonstrates better generalisation to unseen natural signals when using perceptual metrics.
What You Hear Is What You See: Audio Quality Metrics From Image Quality Metrics
May 19, 2023


In this study, we investigate the feasibility of utilizing state-of-the-art image perceptual metrics for evaluating audio signals by representing them as spectrograms. The encouraging outcome of the proposed approach is based on the similarity between the neural mechanisms in the auditory and visual pathways. Furthermore, we customise one of the metrics which has a psychoacoustically plausible architecture to account for the peculiarities of sound signals. We evaluate the effectiveness of our proposed metric and several baseline metrics using a music dataset, with promising results in terms of the correlation between the metrics and the perceived quality of audio as rated by human evaluators.
Disentangling the Link Between Image Statistics and Human Perception
Mar 17, 2023


In the 1950s Horace Barlow and Fred Attneave suggested a connection between sensory systems and how they are adapted to the environment: early vision evolved to maximise the information it conveys about incoming signals. Following Shannon's definition, this information was described using the probability of the images taken from natural scenes. Previously, direct accurate predictions of image probabilities were not possible due to computational limitations. Despite the exploration of this idea being indirect, mainly based on oversimplified models of the image density or on system design methods, these methods had success in reproducing a wide range of physiological and psychophysical phenomena. In this paper, we directly evaluate the probability of natural images and analyse how it may determine perceptual sensitivity. We employ image quality metrics that correlate well with human opinion as a surrogate of human vision, and an advanced generative model to directly estimate the probability. Specifically, we analyse how the sensitivity of full-reference image quality metrics can be predicted from quantities derived directly from the probability distribution of natural images. First, we compute the mutual information between a wide range of probability surrogates and the sensitivity of the metrics and find that the most influential factor is the probability of the noisy image. Then we explore how these probability surrogates can be combined using a simple model to predict the metric sensitivity, giving an upper bound for the correlation of 0.85 between the model predictions and the actual perceptual sensitivity. Finally, we explore how to combine the probability surrogates using simple expressions, and obtain two functional forms (using one or two surrogates) that can be used to predict the sensitivity of the human visual system given a particular pair of images.
Identification, explanation and clinical evaluation of hospital patient subtypes
Jan 19, 2023We present a pipeline in which unsupervised machine learning techniques are used to automatically identify subtypes of hospital patients admitted between 2017 and 2021 in a large UK teaching hospital. With the use of state-of-the-art explainability techniques, the identified subtypes are interpreted and assigned clinical meaning. In parallel, clinicians assessed intra-cluster similarities and inter-cluster differences of the identified patient subtypes within the context of their clinical knowledge. By confronting the outputs of both automatic and clinician-based explanations, we aim to highlight the mutual benefit of combining machine learning techniques with clinical expertise.
What and How of Machine Learning Transparency: Building Bespoke Explainability Tools with Interoperable Algorithmic Components
Sep 08, 2022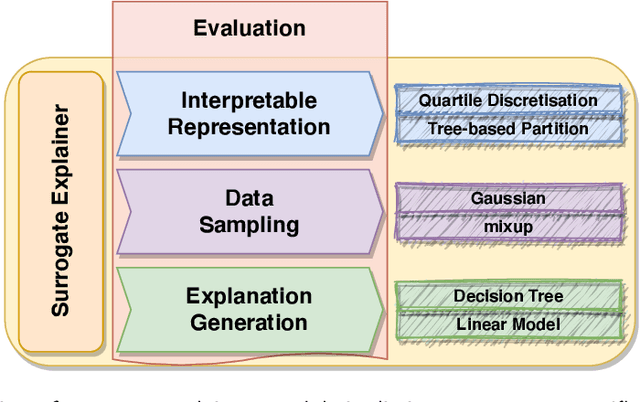
Explainability techniques for data-driven predictive models based on artificial intelligence and machine learning algorithms allow us to better understand the operation of such systems and help to hold them accountable. New transparency approaches are developed at breakneck speed, enabling us to peek inside these black boxes and interpret their decisions. Many of these techniques are introduced as monolithic tools, giving the impression of one-size-fits-all and end-to-end algorithms with limited customisability. Nevertheless, such approaches are often composed of multiple interchangeable modules that need to be tuned to the problem at hand to produce meaningful explanations. This paper introduces a collection of hands-on training materials -- slides, video recordings and Jupyter Notebooks -- that provide guidance through the process of building and evaluating bespoke modular surrogate explainers for tabular data. These resources cover the three core building blocks of this technique: interpretable representation composition, data sampling and explanation generation.
FAT Forensics: A Python Toolbox for Implementing and Deploying Fairness, Accountability and Transparency Algorithms in Predictive Systems
Sep 08, 2022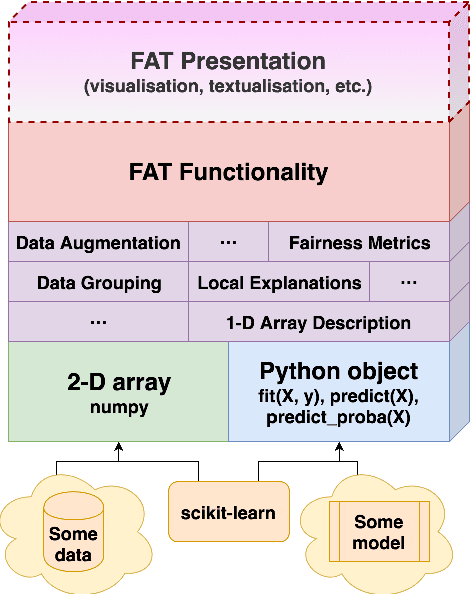
Predictive systems, in particular machine learning algorithms, can take important, and sometimes legally binding, decisions about our everyday life. In most cases, however, these systems and decisions are neither regulated nor certified. Given the potential harm that these algorithms can cause, their qualities such as fairness, accountability and transparency (FAT) are of paramount importance. To ensure high-quality, fair, transparent and reliable predictive systems, we developed an open source Python package called FAT Forensics. It can inspect important fairness, accountability and transparency aspects of predictive algorithms to automatically and objectively report them back to engineers and users of such systems. Our toolbox can evaluate all elements of a predictive pipeline: data (and their features), models and predictions. Published under the BSD 3-Clause open source licence, FAT Forensics is opened up for personal and commercial usage.