 Add to Chrome
 Add to Firefox
 Add to Edge
"Time Series Analysis": models, code, and papers
Toeplitz Least Squares Problems, Fast Algorithms and Big Data
Dec 24, 2021
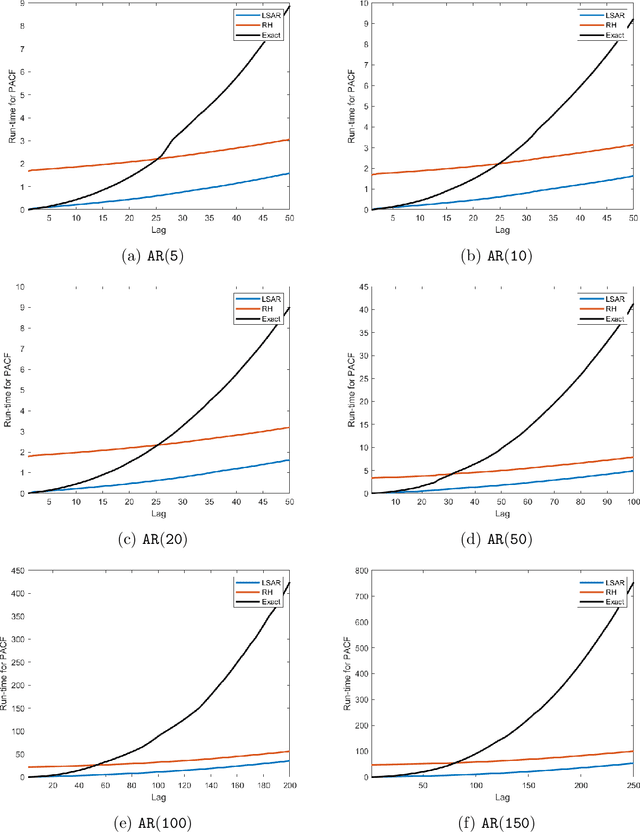
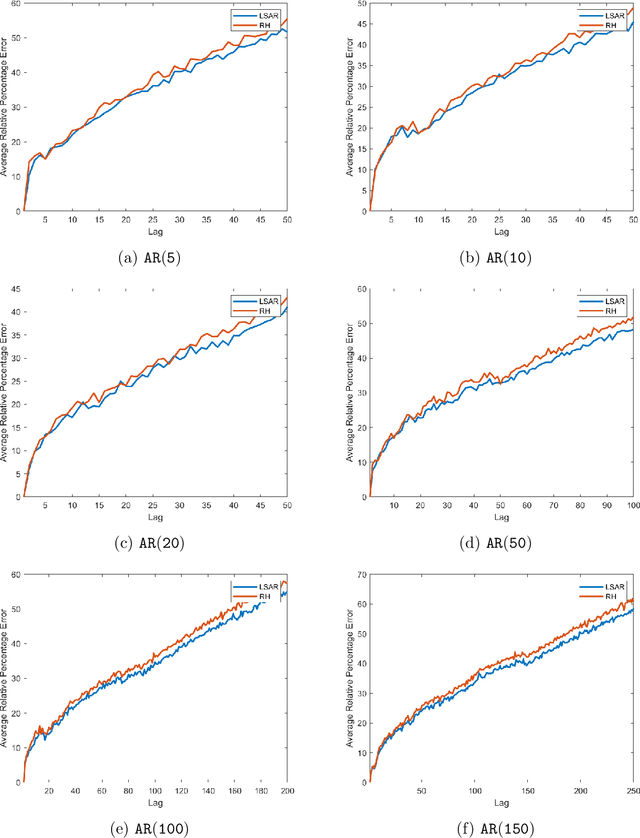
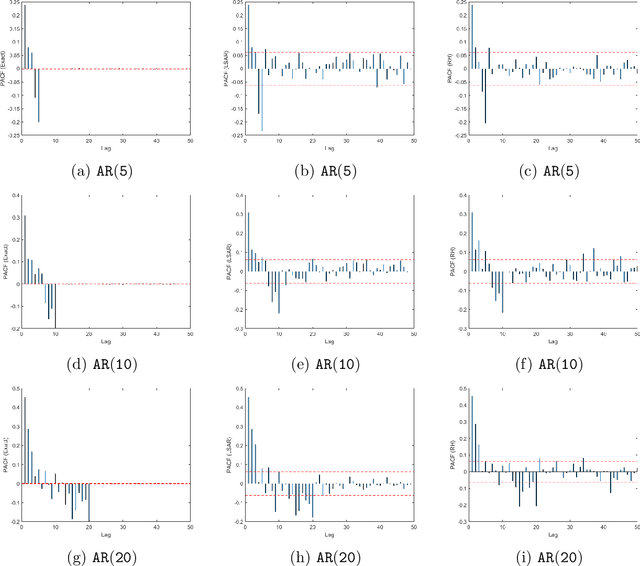
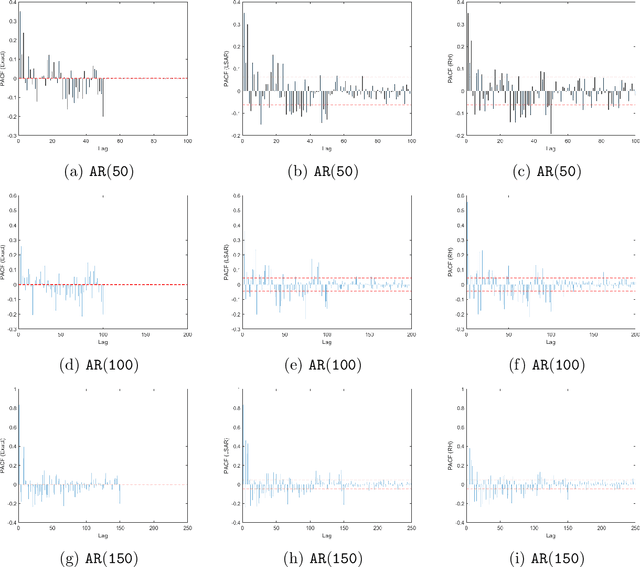
In time series analysis, when fitting an autoregressive model, one must solve a Toeplitz ordinary least squares problem numerous times to find an appropriate model, which can severely affect computational times with large data sets. Two recent algorithms (LSAR and Repeated Halving) have applied randomized numerical linear algebra (RandNLA) techniques to fitting an autoregressive model to big time-series data. We investigate and compare the quality of these two approximation algorithms on large-scale synthetic and real-world data. While both algorithms display comparable results for synthetic datasets, the LSAR algorithm appears to be more robust when applied to real-world time series data. We conclude that RandNLA is effective in the context of big-data time series.
Predicting the outcome of team movements -- Player time series analysis using fuzzy and deep methods for representation learning
Sep 13, 2021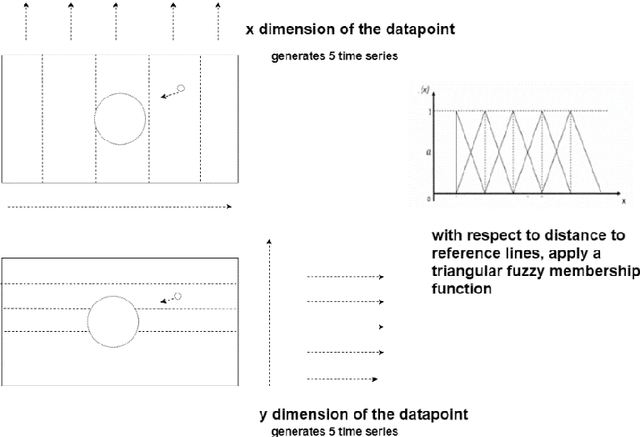
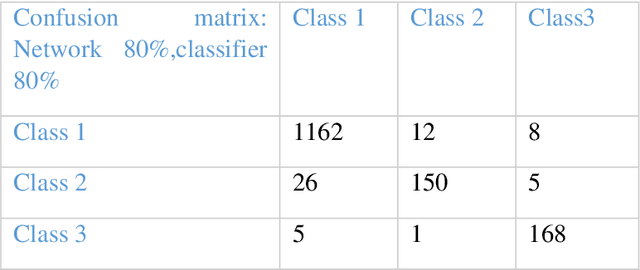
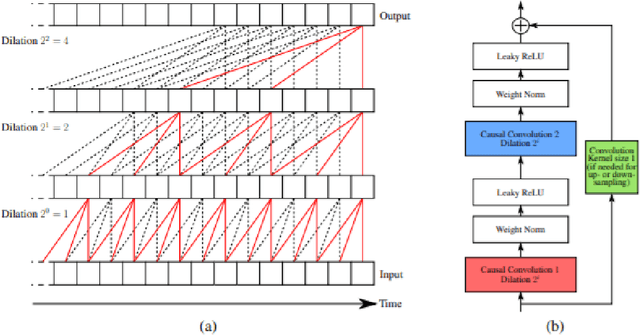
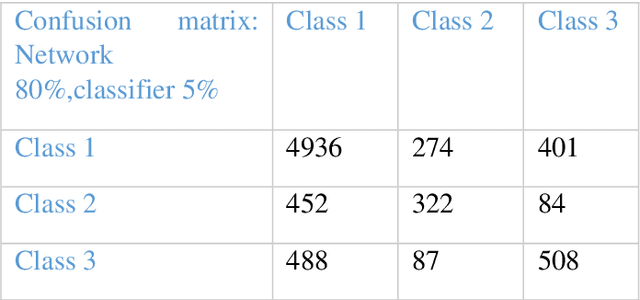
We extract and use player position time-series data, tagged along with the action types, to build a competent model for representing team tactics behavioral patterns and use this representation to predict the outcome of arbitrary movements. We provide a framework for the useful encoding of short tactics and space occupations in a more extended sequence of movements or tactical plans. We investigate game segments during a match in which the team in possession of the ball regularly attempts to reach a position where they can take a shot at goal for a single game. A carefully designed and efficient kernel is employed using a triangular fuzzy membership function to create multiple time series for players' potential of presence at different court regions. Unsupervised learning is then used for time series using triplet loss and deep neural networks with exponentially dilated causal convolutions for the derived multivariate time series. This works key contribution lies in its approach to model how short scenes contribute to other longer ones and how players occupies and creates new spaces in-game court. We discuss the effectiveness of the proposed approach for prediction and recognition tasks on the professional basketball SportVU dataset for the 2015-16 half-season. The proposed system demonstrates descent functionality even with relatively small data.
Quantifying How Hateful Communities Radicalize Online Users
Oct 02, 2022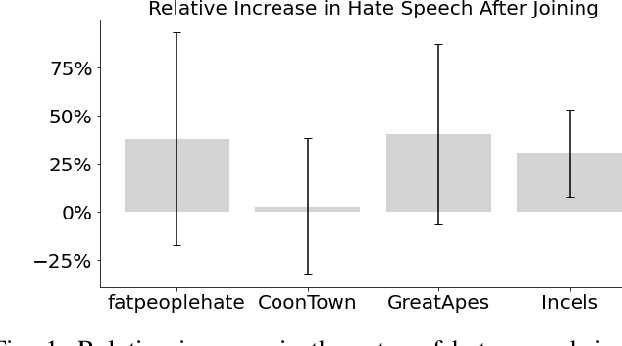
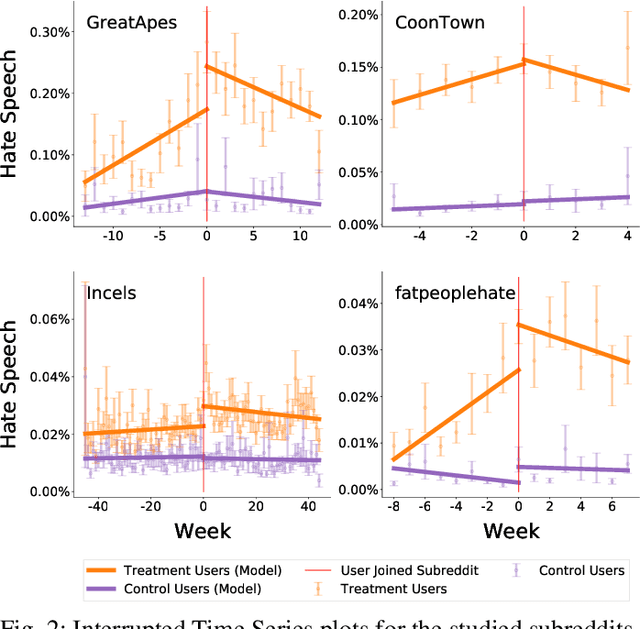
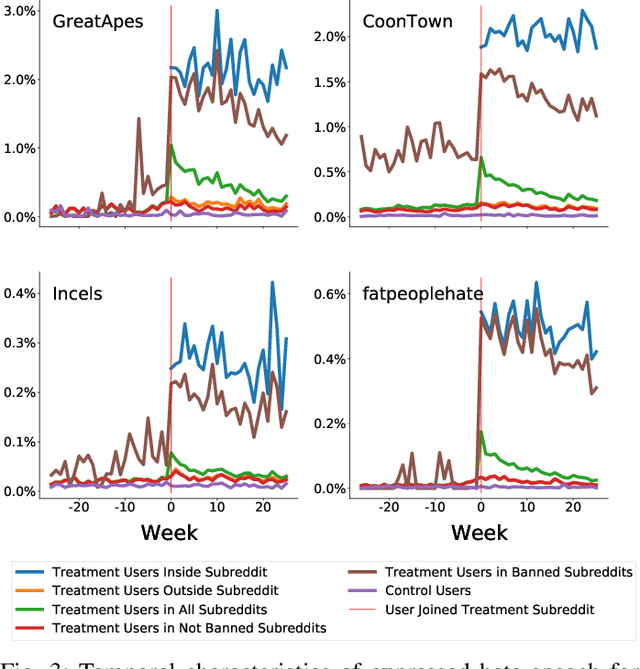
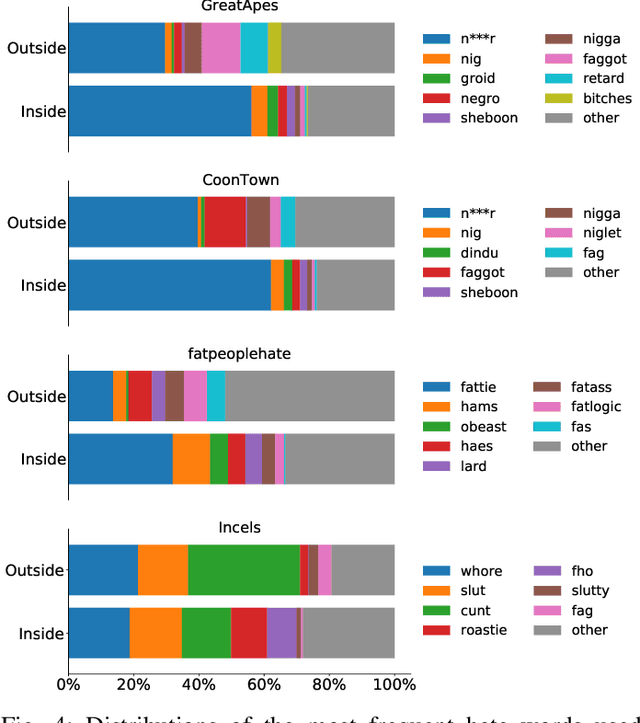
While online social media offers a way for ignored or stifled voices to be heard, it also allows users a platform to spread hateful speech. Such speech usually originates in fringe communities, yet it can spill over into mainstream channels. In this paper, we measure the impact of joining fringe hateful communities in terms of hate speech propagated to the rest of the social network. We leverage data from Reddit to assess the effect of joining one type of echo chamber: a digital community of like-minded users exhibiting hateful behavior. We measure members' usage of hate speech outside the studied community before and after they become active participants. Using Interrupted Time Series (ITS) analysis as a causal inference method, we gauge the spillover effect, in which hateful language from within a certain community can spread outside that community by using the level of out-of-community hate word usage as a proxy for learned hate. We investigate four different Reddit sub-communities (subreddits) covering three areas of hate speech: racism, misogyny and fat-shaming. In all three cases we find an increase in hate speech outside the originating community, implying that joining such community leads to a spread of hate speech throughout the platform. Moreover, users are found to pick up this new hateful speech for months after initially joining the community. We show that the harmful speech does not remain contained within the community. Our results provide new evidence of the harmful effects of echo chambers and the potential benefit of moderating them to reduce adoption of hateful speech.
Geometric Optimisation on Manifolds with Applications to Deep Learning
Mar 09, 2022
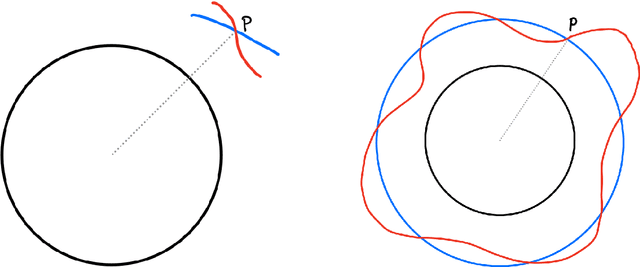
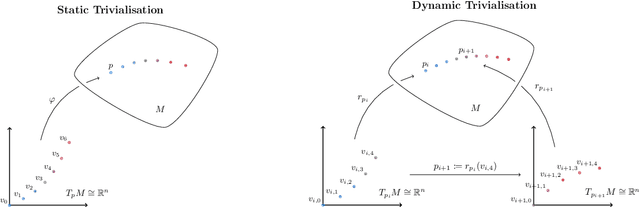
We design and implement a Python library to help the non-expert using all these powerful tools in a way that is efficient, extensible, and simple to incorporate into the workflow of the data scientist, practitioner, and applied researcher. The algorithms implemented in this library have been designed with usability and GPU efficiency in mind, and they can be added to any PyTorch model with just one extra line of code. We showcase the effectiveness of these tools on an application of optimisation on manifolds in the setting of time series analysis. In this setting, orthogonal and unitary optimisation is used to constraint and regularise recurrent models and avoid vanishing and exploding gradient problems. The algorithms designed for GeoTorch allow us to achieve state of the art results in the standard tests for this family of models. We use tools from comparison geometry to give bounds on quantities that are of interest in optimisation problems. In particular, we build on the work of (Kaul 1976) to give explicit bounds on the norm of the second derivative of the Riemannian exponential.
DeepGuard: A Framework for Safeguarding Autonomous Driving Systems from Inconsistent Behavior
Nov 18, 2021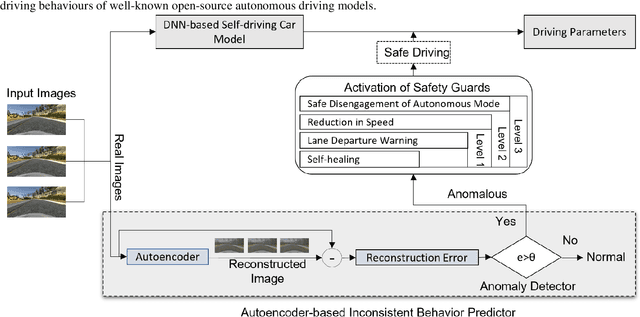
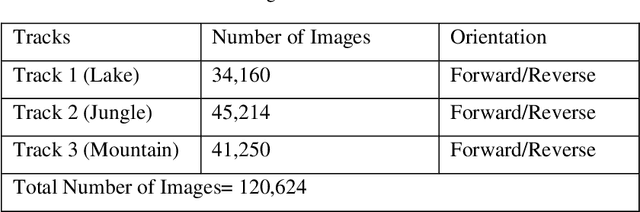
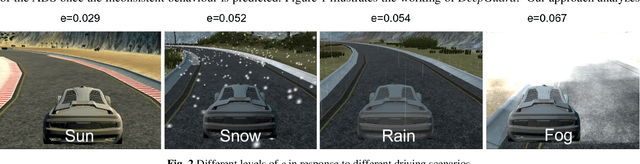
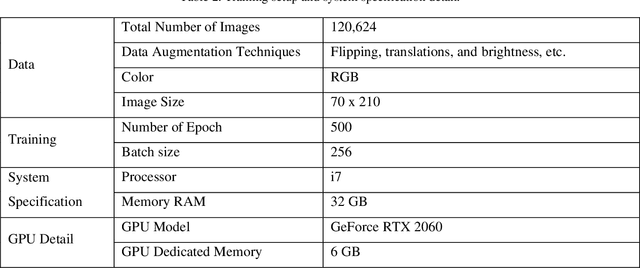
The deep neural networks (DNNs)based autonomous driving systems (ADSs) are expected to reduce road accidents and improve safety in the transportation domain as it removes the factor of human error from driving tasks. The DNN based ADS sometimes may exhibit erroneous or unexpected behaviors due to unexpected driving conditions which may cause accidents. It is not possible to generalize the DNN model performance for all driving conditions. Therefore, the driving conditions that were not considered during the training of the ADS may lead to unpredictable consequences for the safety of autonomous vehicles. This study proposes an autoencoder and time series analysis based anomaly detection system to prevent the safety critical inconsistent behavior of autonomous vehicles at runtime. Our approach called DeepGuard consists of two components. The first component, the inconsistent behavior predictor, is based on an autoencoder and time series analysis to reconstruct the driving scenarios. Based on reconstruction error and threshold it determines the normal and unexpected driving scenarios and predicts potential inconsistent behavior. The second component provides on the fly safety guards, that is, it automatically activates healing strategies to prevent inconsistencies in the behavior. We evaluated the performance of DeepGuard in predicting the injected anomalous driving scenarios using already available open sourced DNN based ADSs in the Udacity simulator. Our simulation results show that the best variant of DeepGuard can predict up to 93 percent on the CHAUFFEUR ADS, 83 percent on DAVE2 ADS, and 80 percent of inconsistent behavior on the EPOCH ADS model, outperforming SELFORACLE and DeepRoad. Overall, DeepGuard can prevent up to 89 percent of all predicted inconsistent behaviors of ADS by executing predefined safety guards.
Distribution estimation and change-point detection for time series via DNN-based GANs
Nov 26, 2022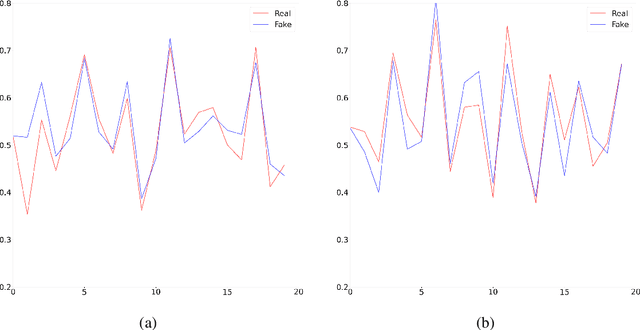
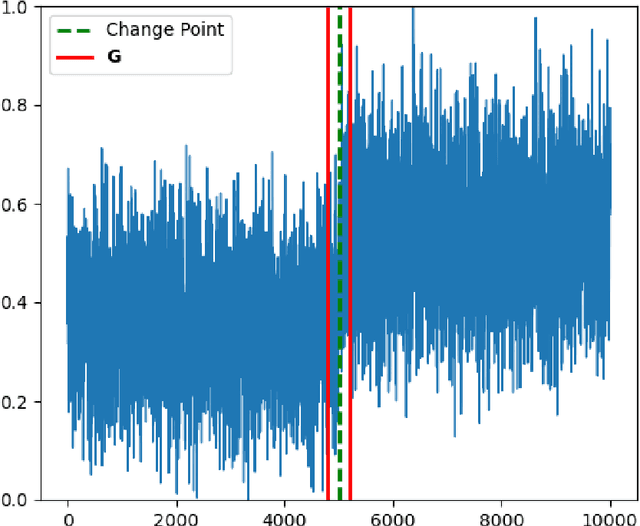
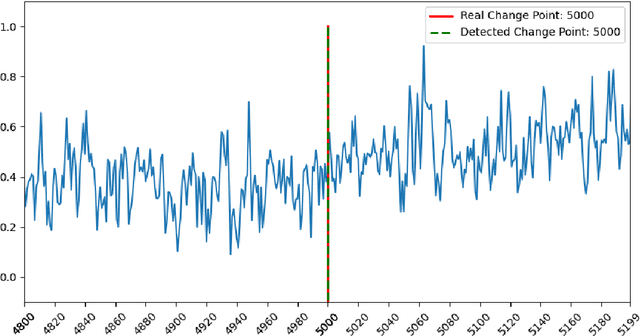
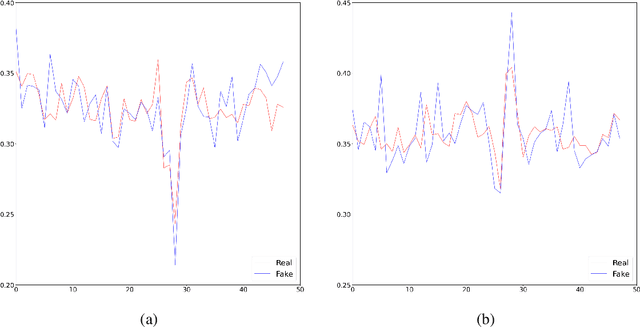
The generative adversarial networks (GANs) have recently been applied to estimating the distribution of independent and identically distributed data, and got excellent performances. In this paper, we use the blocking technique to demonstrate the effectiveness of GANs for estimating the distribution of stationary time series. Theoretically, we obtain a non-asymptotic error bound for the Deep Neural Network (DNN)-based GANs estimator for the stationary distribution of the time series. Based on our theoretical analysis, we put forward an algorithm for detecting the change-point in time series. We simulate in our first experiment a stationary time series by the multivariate autoregressive model to test our GAN estimator, while the second experiment is to use our proposed algorithm to detect the change-point in a time series sequence. Both perform very well. The third experiment is to use our GAN estimator to learn the distribution of a real financial time series data, which is not stationary, we can see from the experiment results that our estimator cannot match the distribution of the time series very well but give the right changing tendency.
Are Transformers Effective for Time Series Forecasting?
Jun 01, 2022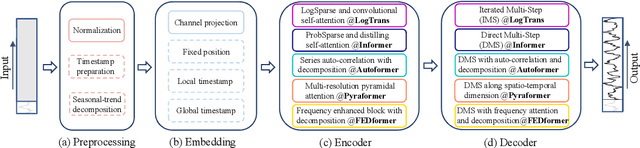
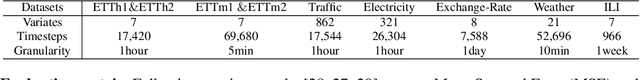
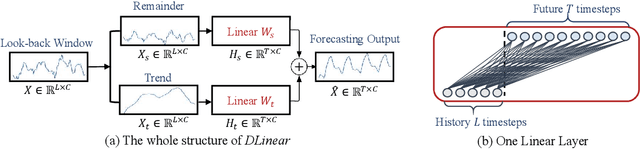
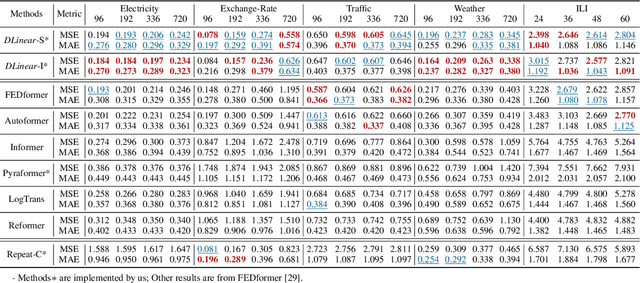
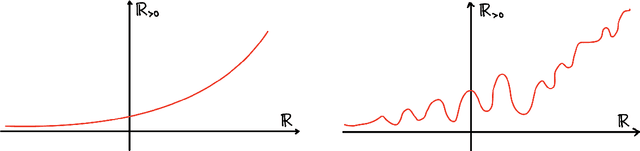
Recently, there has been a surge of Transformer-based solutions for the time series forecasting (TSF) task, especially for the challenging long-term TSF problem. Transformer architecture relies on self-attention mechanisms to effectively extract the semantic correlations between paired elements in a long sequence, which is permutation-invariant and anti-ordering to some extent. However, in time series modeling, we are to extract the temporal relations among an ordering set of continuous points. Consequently, whether Transformer-based techniques are the right solutions for long-term time series forecasting is an interesting problem to investigate, despite the performance improvements shown in these studies. In this work, we question the validity of Transformer-based TSF solutions. In their experiments, the compared (non-Transformer) baselines are mainly autoregressive forecasting solutions, which usually have a poor long-term prediction capability due to inevitable error accumulation effects. In contrast, we use an embarrassingly simple architecture named DLinear that conducts direct multi-step (DMS) forecasting for comparison. DLinear decomposes the time series into a trend and a remainder series and employs two one-layer linear networks to model these two series for the forecasting task. Surprisingly, it outperforms existing complex Transformer-based models in most cases by a large margin. Therefore, we conclude that the relatively higher long-term forecasting accuracy of Transformer-based TSF solutions shown in existing works has little to do with the temporal relation extraction capabilities of the Transformer architecture. Instead, it is mainly due to the non-autoregressive DMS forecasting strategy used in them. We hope this study also advocates revisiting the validity of Transformer-based solutions for other time series analysis tasks (e.g., anomaly detection) in the future.
Sinusoidal Frequency Estimation by Gradient Descent
Oct 26, 2022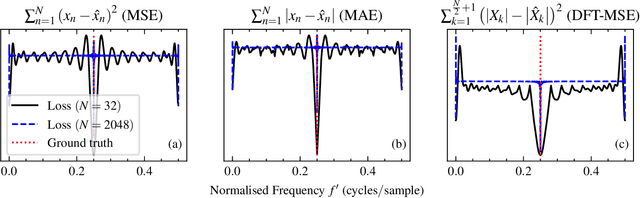
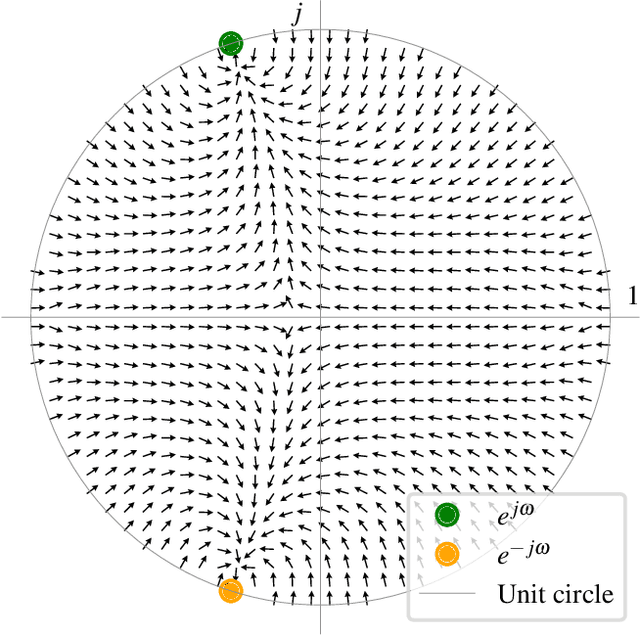
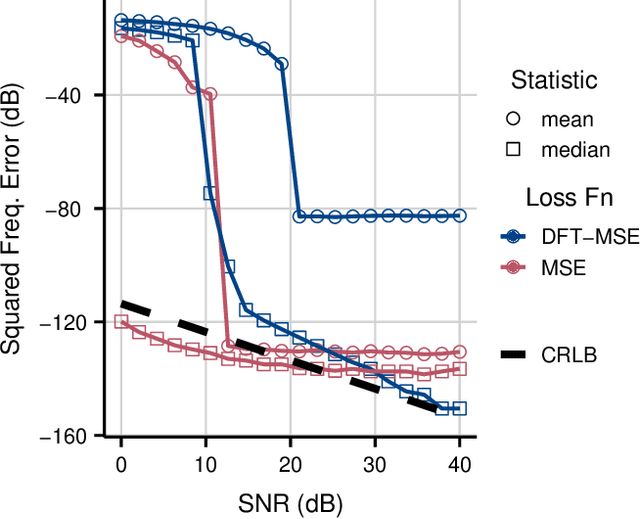
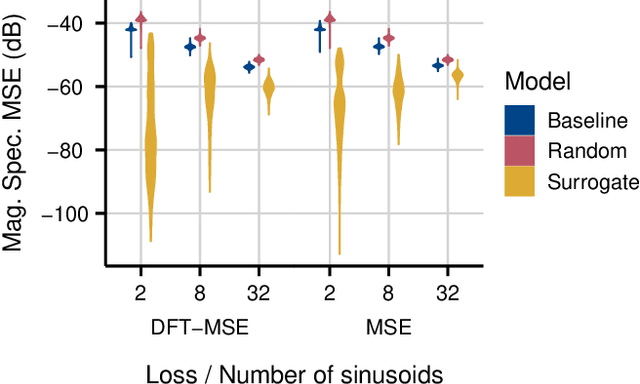
Sinusoidal parameter estimation is a fundamental task in applications from spectral analysis to time-series forecasting. Estimating the sinusoidal frequency parameter by gradient descent is, however, often impossible as the error function is non-convex and densely populated with local minima. The growing family of differentiable signal processing methods has therefore been unable to tune the frequency of oscillatory components, preventing their use in a broad range of applications. This work presents a technique for joint sinusoidal frequency and amplitude estimation using the Wirtinger derivatives of a complex exponential surrogate and any first order gradient-based optimizer, enabling end to-end training of neural network controllers for unconstrained sinusoidal models.
Human activity recognition based on time series analysis using U-Net
Sep 20, 2018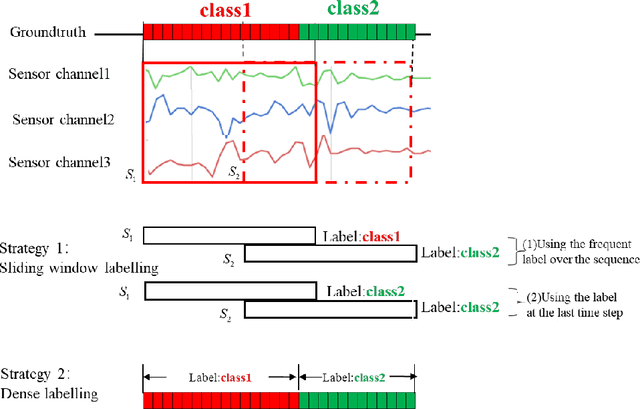
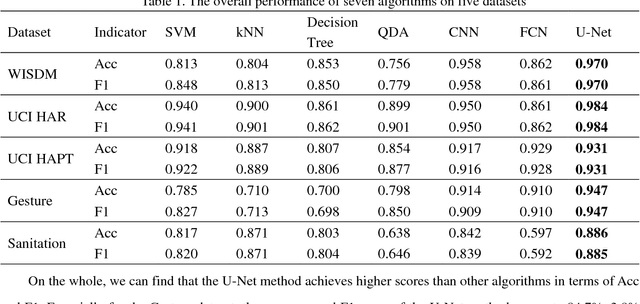
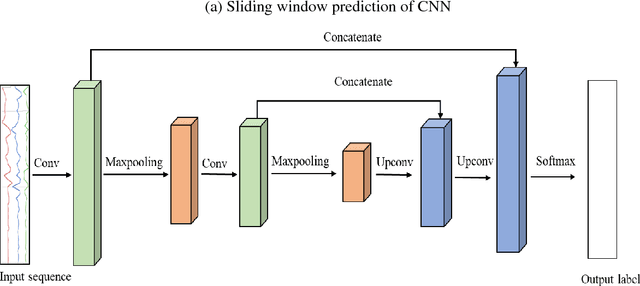
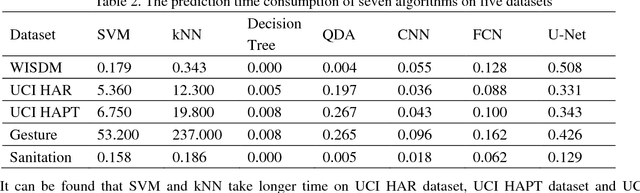
Traditional human activity recognition (HAR) based on time series adopts sliding window analysis method. This method faces the multi-class window problem which mistakenly labels different classes of sampling points within a window as a class. In this paper, a HAR algorithm based on U-Net is proposed to perform activity labeling and prediction at each sampling point. The activity data of the triaxial accelerometer is mapped into an image with the single pixel column and multi-channel which is input into the U-Net network for training and recognition. Our proposal can complete the pixel-level gesture recognition function. The method does not need manual feature extraction and can effectively identify short-term behaviors in long-term activity sequences. We collected the Sanitation dataset and tested the proposed scheme with four open data sets. The experimental results show that compared with Support Vector Machine (SVM), k-Nearest Neighbor (kNN), Decision Tree(DT), Quadratic Discriminant Analysis (QDA), Convolutional Neural Network (CNN) and Fully Convolutional Networks (FCN) methods, our proposal has the highest accuracy and F1-socre in each dataset, and has stable performance and high robustness. At the same time, after the U-Net has finished training, our proposal can achieve fast enough recognition speed.