 Add to Chrome
 Add to Firefox
 Add to Edge
Beyond Land Surface Temperature: Explainable Spatial Machine Learning Reveals Urban Morphology Effects on Human-Centric Heat Stress
Apr 24, 2026Heat exposure connects the built environment and public health, directly shaping the livability and sustainability of urban areas. Understanding the spatial heterogeneity of heat exposure and its drivers is vital for climate-adaptive urban planning. However, most planning-oriented studies rely on land surface temperature (LST), and whether LST adequately represents human heat exposure and how it differs from physiologically relevant heat stress remains insufficiently examined. Here, adopting Landsat-retrieved 30-m LST and GPU-accelerated 1-m universal thermal climate index (UTCI) in Singapore, this study establishes a comprehensive "Modeling-Comparing-Assessing" framework to systematically evaluate the spatial and mechanistic discrepancies between the two metrics. We further investigate pronounced non-stationary and threshold-based quantitative relationships of the two metrics with urban factors by employing a novel geographically weighted XGBoost (GW-XGBoost) and generalized additive model (GAM) workflow. Our results demonstrate notable discrepancies in spatial patterns of LST and UTCI, along with substantial spatial heterogeneity in how 2D and 3D urban factors impact these two thermal metrics, as revealed by explainable GW-XGBoost models (global out-of-bag R2 = 0.855 for LST and 0.905 for UTCI, respectively). Crucially, spatially explicit SHAP interprets that sky view factor plays a central role in explaining UTCI variability but exhibits a comparatively marginal independent contribution to LST, indicating that LST inadequately captures shading-driven and radiative processes governing actual human heat stress. Notably, SHAP-GAM analysis indicates that higher albedo is associated with increased UTCI. These novel findings provide evidence for integrating physiologically relevant thermal indices to inform targeted heat risk management and climate-adaptive urban planning.
Quantifying Urban Canopy Cover with Deep Convolutional Neural Networks
Dec 03, 2019
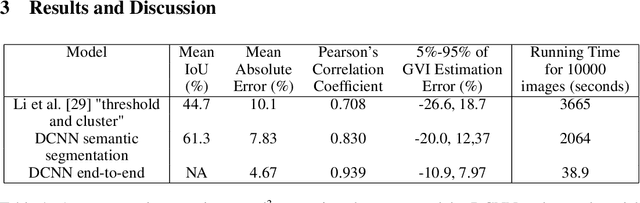
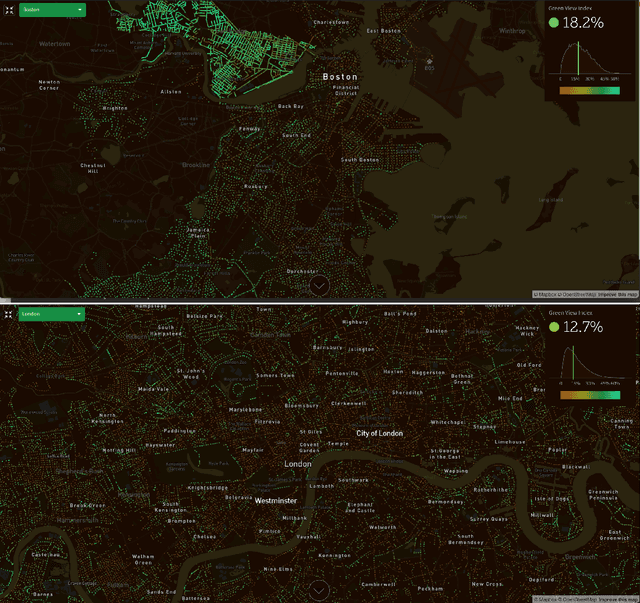
Urban canopy cover is important to mitigate the impact of climate change. Yet, existing quantification of urban greenery is either manual and not scalable, or use traditional computer vision methods that are inaccurate. We train deep convolutional neural networks (DCNNs) on datasets used for self-driving cars to estimate urban greenery instead, and find that our semantic segmentation and direct end-to-end estimation method are more accurate and scalable, reducing mean absolute error of estimating the Green View Index (GVI) metric from 10.1% to 4.67%. With the revised DCNN methods, the Treepedia project was able to scale and analyze canopy cover in 22 cities internationally, sparking interest and action in public policy and research fields.
Treepedia 2.0: Applying Deep Learning for Large-scale Quantification of Urban Tree Cover
Aug 14, 2018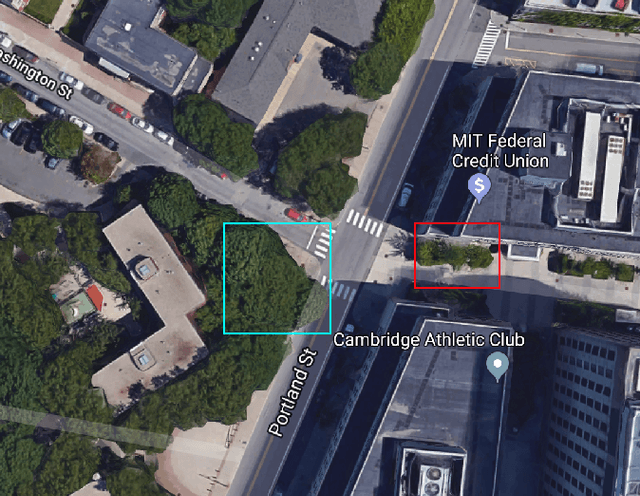
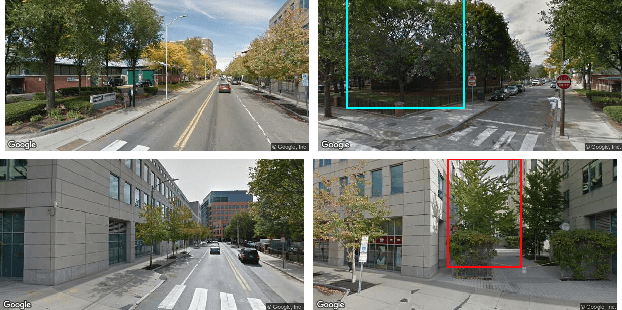
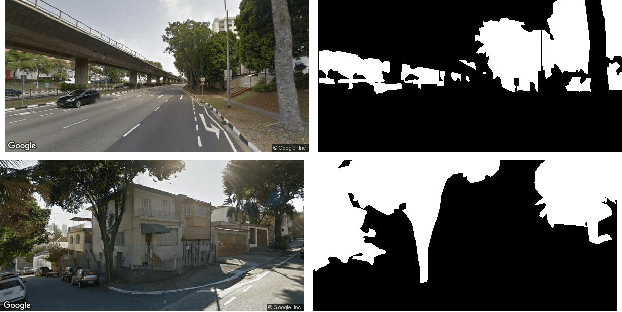
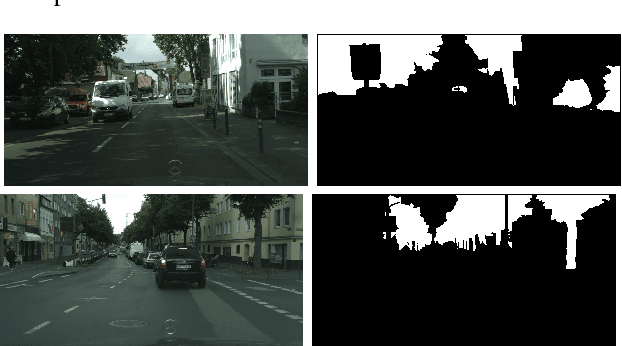
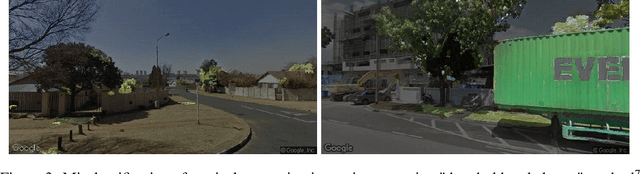
Recent advances in deep learning have made it possible to quantify urban metrics at fine resolution, and over large extents using street-level images. Here, we focus on measuring urban tree cover using Google Street View (GSV) images. First, we provide a small-scale labelled validation dataset and propose standard metrics to compare the performance of automated estimations of street tree cover using GSV. We apply state-of-the-art deep learning models, and compare their performance to a previously established benchmark of an unsupervised method. Our training procedure for deep learning models is novel; we utilize the abundance of openly available and similarly labelled street-level image datasets to pre-train our model. We then perform additional training on a small training dataset consisting of GSV images. We find that deep learning models significantly outperform the unsupervised benchmark method. Our semantic segmentation model increased mean intersection-over-union (IoU) from 44.10% to 60.42% relative to the unsupervised method and our end-to-end model decreased Mean Absolute Error from 10.04% to 4.67%. We also employ a recently developed method called gradient-weighted class activation map (Grad-CAM) to interpret the features learned by the end-to-end model. This technique confirms that the end-to-end model has accurately learned to identify tree cover area as key features for predicting percentage tree cover. Our paper provides an example of applying advanced deep learning techniques on a large-scale, geo-tagged and image-based dataset to efficiently estimate important urban metrics. The results demonstrate that deep learning models are highly accurate, can be interpretable, and can also be efficient in terms of data-labelling effort and computational resources.
A novel method for predicting and mapping the presence of sun glare using Google Street View
Aug 05, 2018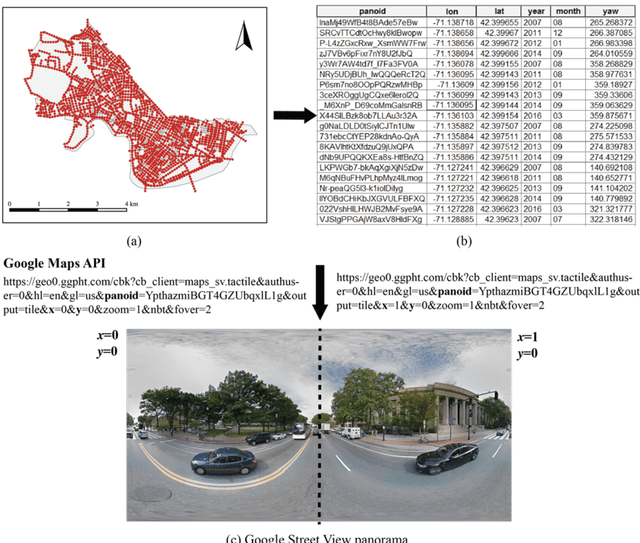
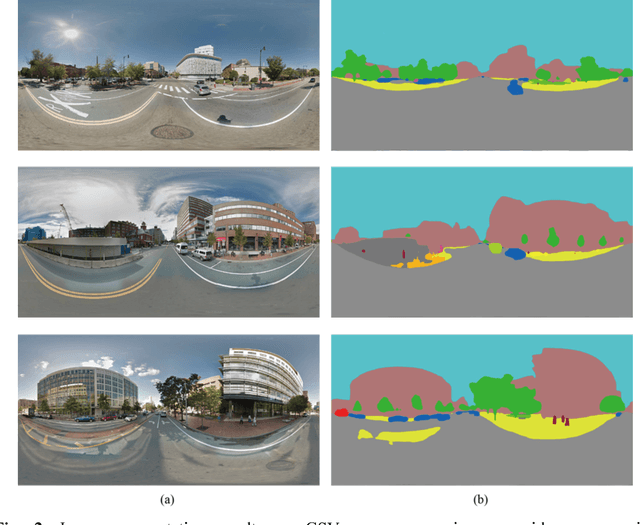
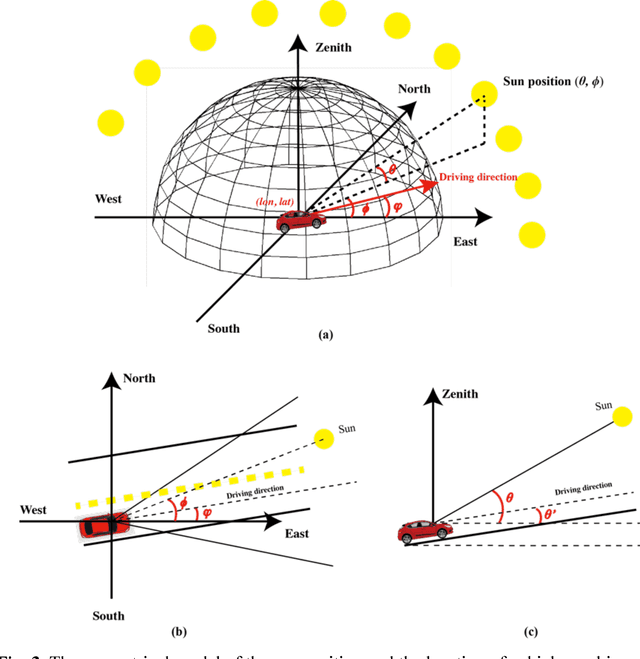
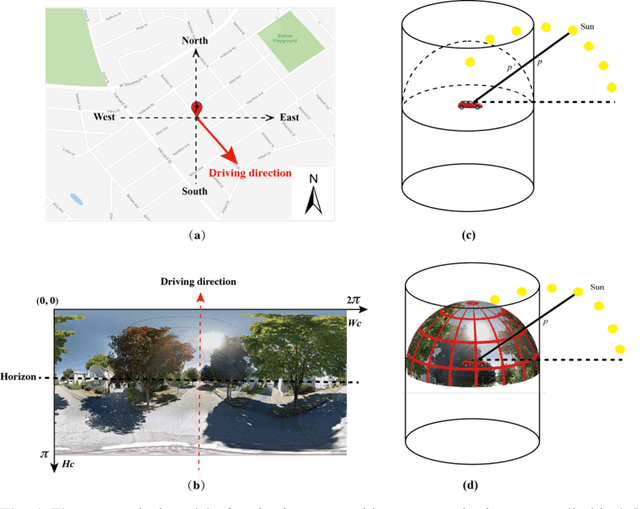
The sun glare is one of the major environmental hazards that cause traffic accidents. Every year, many people died and injured in traffic accidents related to sun glare. Providing accurate information about when and where sun glare happens would be helpful to prevent sun glare caused traffic accidents and save lives. In this study, we proposed to use publicly accessible Google Street View (GSV) panorama images to estimate and predict the occurrence of sun glare. GSV images have view sight similar to drivers, which would make GSV images suitable for estimating the visibility of sun glare to drivers. A recently developed convolutional neural network algorithm was used to segment GSV images and predict obstructions on sun glare. Based on the predicted obstructions for given locations, we further estimated the time windows of sun glare by estimating the sun positions and the relative angles between drivers and the sun for those locations. We conducted a case study in Cambridge, Massachusetts, USA. Results show that the method can predict the presence of sun glare precisely. The proposed method would provide an important tool for drivers and traffic planners to mitigate the sun glare and decrease the potential traffic accidents caused by the sun glare.