 Add to Chrome
 Add to Firefox
 Add to Edge
MOMO: Mars Orbital Model Foundation Model for Mars Orbital Applications
Apr 03, 2026We introduce MOMO, the first multi-sensor foundation model for Mars remote sensing. MOMO uses model merge to integrate representations learned independently from three key Martian sensors (HiRISE, CTX, and THEMIS), spanning resolutions from 0.25 m/pixel to 100 m/pixel. Central to our method is our novel Equal Validation Loss (EVL) strategy, which aligns checkpoints across sensors based on validation loss similarity before fusion via task arithmetic. This ensures models are merged at compatible convergence stages, leading to improved stability and generalization. We train MOMO on a large-scale, high-quality corpus of $\sim 12$ million samples curated from Mars orbital data and evaluate it on 9 downstream tasks from Mars-Bench. MOMO achieves better overall performance compared to ImageNet pre-trained, earth observation foundation model, sensor-specific pre-training, and fully-supervised baselines. Particularly on segmentation tasks, MOMO shows consistent and significant performance improvement. Our results demonstrate that model merging through an optimal checkpoint selection strategy provides an effective approach for building foundation models for multi-resolution data. The model weights, pretraining code, pretraining data, and evaluation code are available at: https://github.com/kerner-lab/MOMO.
Time Series Comparisons in Deep Space Network
Nov 02, 2021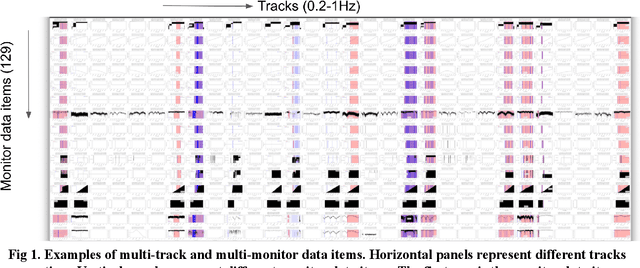
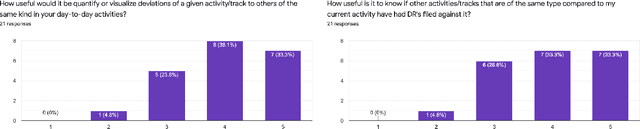
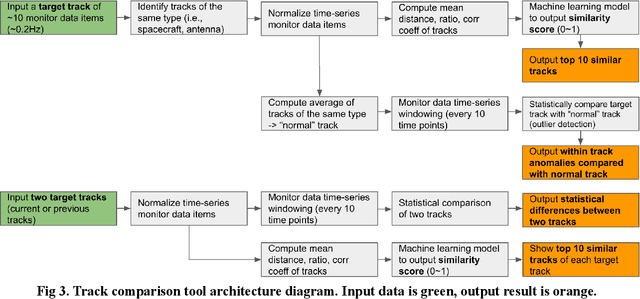
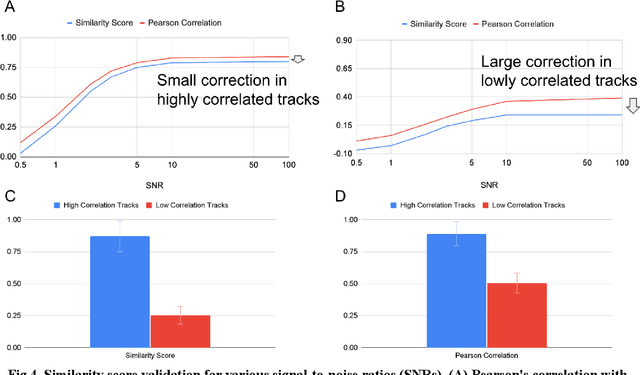
The Deep Space Network is NASA's international array of antennas that support interplanetary spacecraft missions. A track is a block of multi-dimensional time series from the beginning to end of DSN communication with the target spacecraft, containing thousands of monitor data items lasting several hours at a frequency of 0.2-1Hz. Monitor data on each track reports on the performance of specific spacecraft operations and the DSN itself. DSN is receiving signals from 32 spacecraft across the solar system. DSN has pressure to reduce costs while maintaining the quality of support for DSN mission users. DSN Link Control Operators need to simultaneously monitor multiple tracks and identify anomalies in real time. DSN has seen that as the number of missions increases, the data that needs to be processed increases over time. In this project, we look at the last 8 years of data for analysis. Any anomaly in the track indicates a problem with either the spacecraft, DSN equipment, or weather conditions. DSN operators typically write Discrepancy Reports for further analysis. It is recognized that it would be quite helpful to identify 10 similar historical tracks out of the huge database to quickly find and match anomalies. This tool has three functions: (1) identification of the top 10 similar historical tracks, (2) detection of anomalies compared to the reference normal track, and (3) comparison of statistical differences between two given tracks. The requirements for these features were confirmed by survey responses from 21 DSN operators and engineers. The preliminary machine learning model has shown promising performance (AUC=0.92). We plan to increase the number of data sets and perform additional testing to improve performance further before its planned integration into the track visualizer interface to assist DSN field operators and engineers.
Finding Anomalous Periodic Time Series: An Application to Catalogs of Periodic Variable Stars
May 21, 2009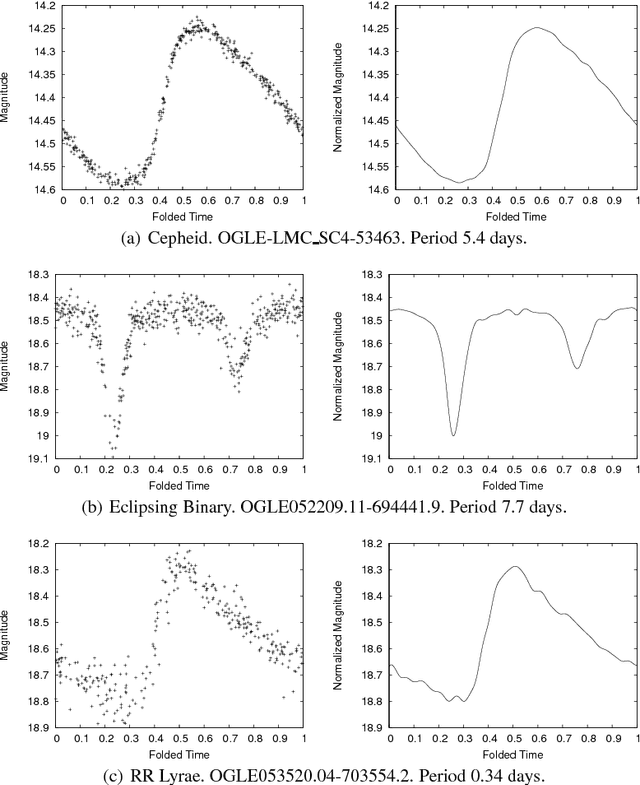
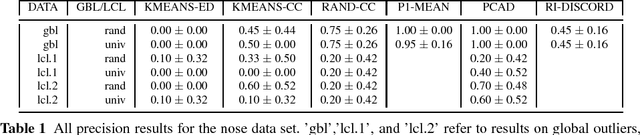
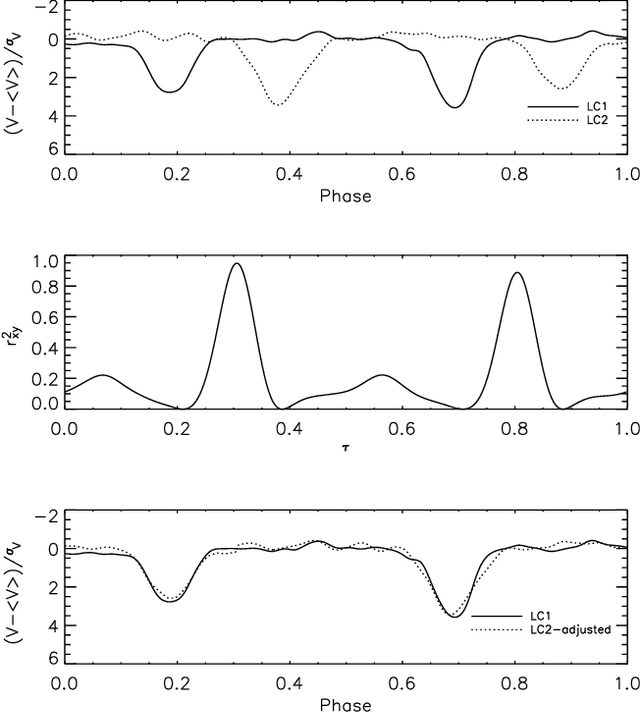
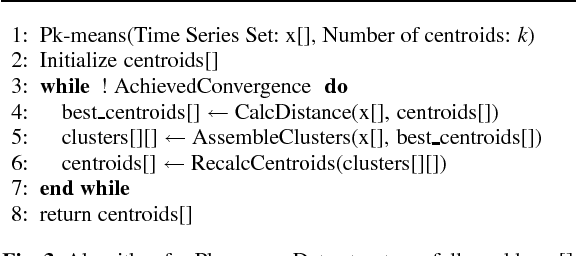
Catalogs of periodic variable stars contain large numbers of periodic light-curves (photometric time series data from the astrophysics domain). Separating anomalous objects from well-known classes is an important step towards the discovery of new classes of astronomical objects. Most anomaly detection methods for time series data assume either a single continuous time series or a set of time series whose periods are aligned. Light-curve data precludes the use of these methods as the periods of any given pair of light-curves may be out of sync. One may use an existing anomaly detection method if, prior to similarity calculation, one performs the costly act of aligning two light-curves, an operation that scales poorly to massive data sets. This paper presents PCAD, an unsupervised anomaly detection method for large sets of unsynchronized periodic time-series data, that outputs a ranked list of both global and local anomalies. It calculates its anomaly score for each light-curve in relation to a set of centroids produced by a modified k-means clustering algorithm. Our method is able to scale to large data sets through the use of sampling. We validate our method on both light-curve data and other time series data sets. We demonstrate its effectiveness at finding known anomalies, and discuss the effect of sample size and number of centroids on our results. We compare our method to naive solutions and existing time series anomaly detection methods for unphased data, and show that PCAD's reported anomalies are comparable to or better than all other methods. Finally, astrophysicists on our team have verified that PCAD finds true anomalies that might be indicative of novel astrophysical phenomena.