 Add to Chrome
 Add to Firefox
 Add to Edge
Three-Dimensional Retinal Microvasculature Restoration in OCT Angiography
Jun 03, 2026Optical coherence tomographic angiography (OCTA) is a powerful technique for imaging retinal microvasculature. However, acquiring reliable quantification of retinal blood flow and areas of retinal nonperfusion is challenging because of imaging artifacts. Existing methods primarily focus on noise suppression, projection artifact removal, or signal enhancement to improve the image quality of OCTA in cross-sectional or two-dimensional (2D) en face projections, while neglecting the intrinsic three-dimensional vascular architecture. In this study, we propose a deep learning-based algorithm for restoring capillary anatomical vasculature from a single OCTA volume. The network consists of an EfficientNet-B5 encoder and a decoder incorporating concurrent spatial and channel squeeze-and-excitation modules, connected via skip connections to preserve spatial resolution. Three adjacent B-frames are used as input to predict the restored middle B-frame. We evaluated the performance of the model using the peak signal-to-noise ratio (PSNR) and structural similarity index measure (SSIM) against ground truth generated from averaging multiple scans. The results show that the proposed model significantly (both p < 0.001) improved image quality compared with the original single OCTA volume, with a PSNR of 26.16 +/- 1.26 vs. 22.23 +/- 0.78 and an SSIM of 0.91 +/- 0.02 vs. 0.72 +/- 0.03. The proposed model also significantly (p < 0.001) improved microvascular fidelity, measured by the Dice coefficient overlap between the model output and ground truth, in both 2D and 3D by at least 3.8% and 51.2%, respectively, across several different vascular slabs.
Interpretable Diabetic Retinopathy Diagnosis based on Biomarker Activation Map
Dec 13, 2022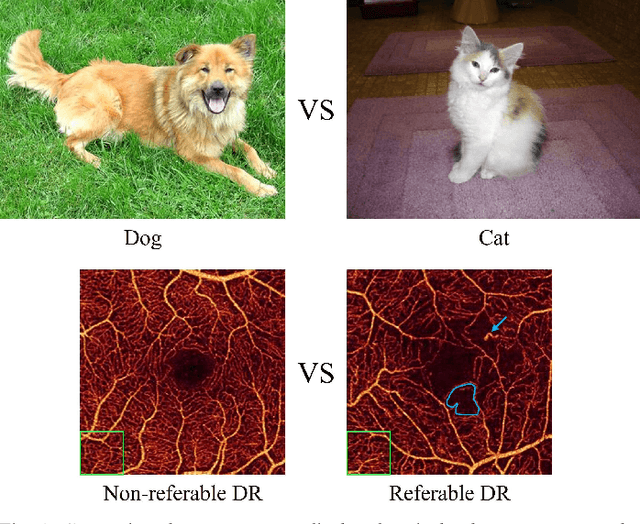
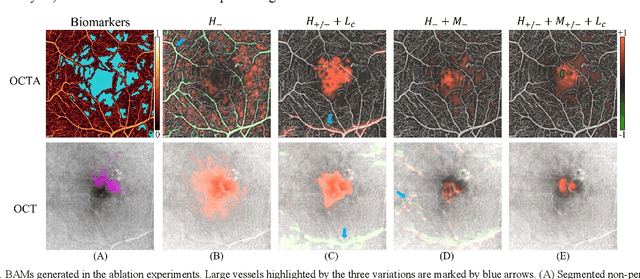
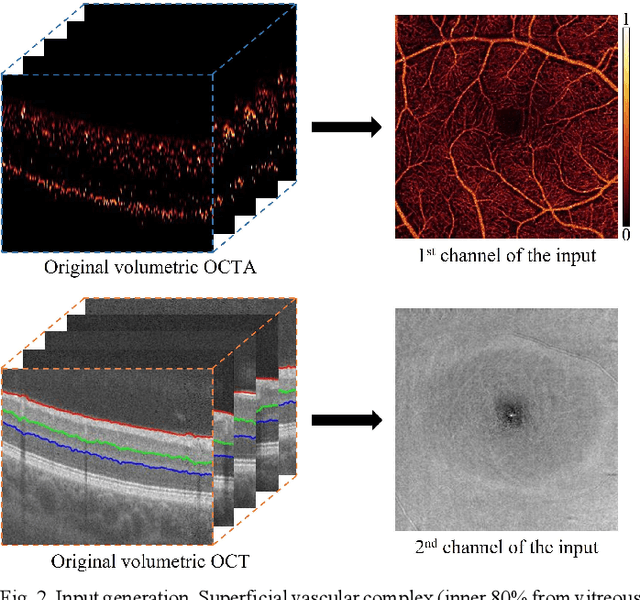
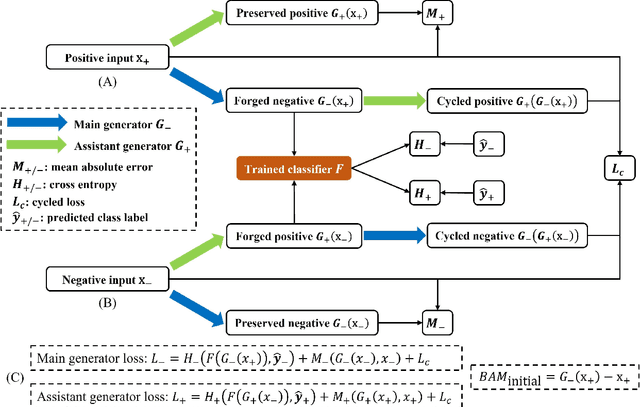
Deep learning classifiers provide the most accurate means of automatically diagnosing diabetic retinopathy (DR) based on optical coherence tomography (OCT) and its angiography (OCTA). The power of these models is attributable in part to the inclusion of hidden layers that provide the complexity required to achieve a desired task. However, hidden layers also render algorithm outputs difficult to interpret. Here we introduce a novel biomarker activation map (BAM) framework based on generative adversarial learning that allows clinicians to verify and understand classifiers decision-making. A data set including 456 macular scans were graded as non-referable or referable DR based on current clinical standards. A DR classifier that was used to evaluate our BAM was first trained based on this data set. The BAM generation framework was designed by combing two U-shaped generators to provide meaningful interpretability to this classifier. The main generator was trained to take referable scans as input and produce an output that would be classified by the classifier as non-referable. The BAM is then constructed as the difference image between the output and input of the main generator. To ensure that the BAM only highlights classifier-utilized biomarkers an assistant generator was trained to do the opposite, producing scans that would be classified as referable by the classifier from non-referable scans. The generated BAMs highlighted known pathologic features including nonperfusion area and retinal fluid. A fully interpretable classifier based on these highlights could help clinicians better utilize and verify automated DR diagnosis.
DcardNet: Diabetic Retinopathy Classification at Multiple Depths Based on Structural and Angiographic Optical Coherence Tomography
Jun 09, 2020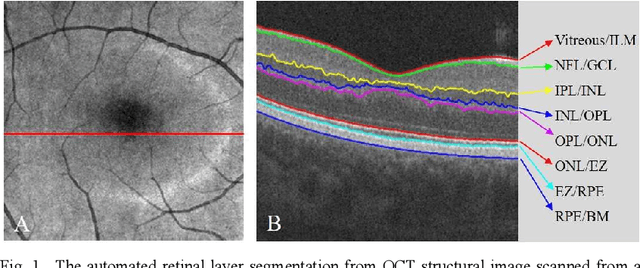
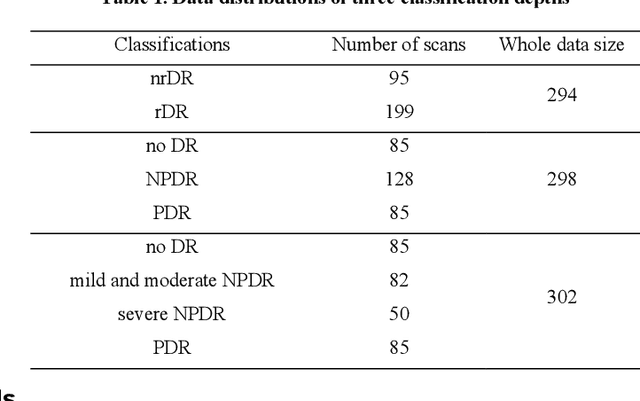
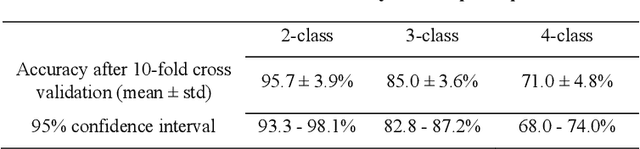
Optical coherence tomography (OCT) and its angiography (OCTA) have several advantages for the early detection and diagnosis of diabetic retinopathy (DR). However, automated, complete DR classification frameworks based on both OCT and OCTA data have not been proposed. In this study, a densely and continuously connected neural network with adaptive rate dropout (DcardNet) is proposed to fulfill a DR classification framework using en face OCT and OCTA. The proposed network outputs three separate classification depths on each case based on the International Clinical Diabetic Retinopathy scale. At the highest level the network classifies scans as referable or non-referable for DR. The second depth classifies the eye as non-DR, non-proliferative DR (NPDR), or proliferative DR (PDR). The last depth classifies the case as no DR, mild and moderate NPDR, severe NPDR, and PDR. We used 10-fold cross-validation with 10% of the data to assess the performance of our network. The overall classification accuracies of the three depths were 95.7%, 85.0%, and 71.0% respectively.
Automated segmentation of retinal fluid volumes from structural and angiographic optical coherence tomography using deep learning
Jun 03, 2020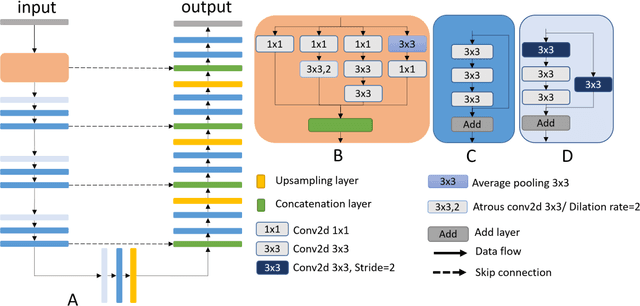
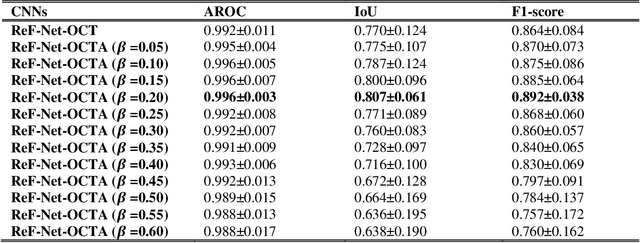
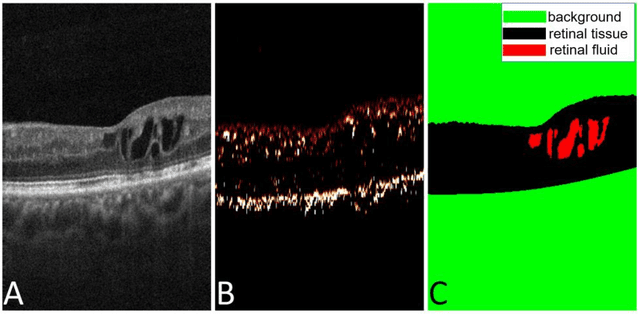
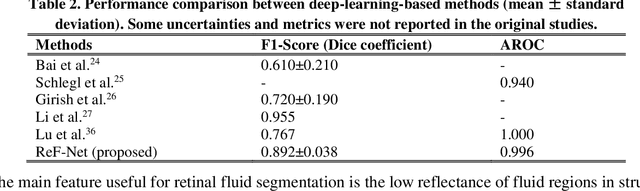
Purpose: We proposed a deep convolutional neural network (CNN), named Retinal Fluid Segmentation Network (ReF-Net) to segment volumetric retinal fluid on optical coherence tomography (OCT) volume. Methods: 3 x 3-mm OCT scans were acquired on one eye by a 70-kHz OCT commercial AngioVue system (RTVue-XR; Optovue, Inc.) from 51 participants in a clinical diabetic retinopathy (DR) study (45 with retinal edema and 6 healthy controls). A CNN with U-Net-like architecture was constructed to detect and segment the retinal fluid. Cross-sectional OCT and angiography (OCTA) scans were used for training and testing ReF-Net. The effect of including OCTA data for retinal fluid segmentation was investigated in this study. Volumetric retinal fluid can be constructed using the output of ReF-Net. Area-under-Receiver-Operating-Characteristic-curve (AROC), intersection-over-union (IoU), and F1-score were calculated to evaluate the performance of ReF-Net. Results: ReF-Net shows high accuracy (F1 = 0.864 +/- 0.084) in retinal fluid segmentation. The performance can be further improved (F1 = 0.892 +/- 0.038) by including information from both OCTA and structural OCT. ReF-Net also shows strong robustness to shadow artifacts. Volumetric retinal fluid can provide more comprehensive information than the 2D area, whether cross-sectional or en face projections. Conclusions: A deep-learning-based method can accurately segment retinal fluid volumetrically on OCT/OCTA scans with strong robustness to shadow artifacts. OCTA data can improve retinal fluid segmentation. Volumetric representations of retinal fluid are superior to 2D projections. Translational Relevance: Using a deep learning method to segment retinal fluid volumetrically has the potential to improve the diagnostic accuracy of diabetic macular edema by OCT systems.