 Add to Chrome
 Add to Firefox
 Add to Edge
Node Embeddings via Neighbor Embeddings
Mar 31, 2025


Graph layouts and node embeddings are two distinct paradigms for non-parametric graph representation learning. In the former, nodes are embedded into 2D space for visualization purposes. In the latter, nodes are embedded into a high-dimensional vector space for downstream processing. State-of-the-art algorithms for these two paradigms, force-directed layouts and random-walk-based contrastive learning (such as DeepWalk and node2vec), have little in common. In this work, we show that both paradigms can be approached with a single coherent framework based on established neighbor embedding methods. Specifically, we introduce graph t-SNE, a neighbor embedding method for two-dimensional graph layouts, and graph CNE, a contrastive neighbor embedding method that produces high-dimensional node representations by optimizing the InfoNCE objective. We show that both graph t-SNE and graph CNE strongly outperform state-of-the-art algorithms in terms of local structure preservation, while being conceptually simpler.
On the Importance of Embedding Norms in Self-Supervised Learning
Feb 13, 2025


Self-supervised learning (SSL) allows training data representations without a supervised signal and has become an important paradigm in machine learning. Most SSL methods employ the cosine similarity between embedding vectors and hence effectively embed data on a hypersphere. While this seemingly implies that embedding norms cannot play any role in SSL, a few recent works have suggested that embedding norms have properties related to network convergence and confidence. In this paper, we resolve this apparent contradiction and systematically establish the embedding norm's role in SSL training. Using theoretical analysis, simulations, and experiments, we show that embedding norms (i) govern SSL convergence rates and (ii) encode network confidence, with smaller norms corresponding to unexpected samples. Additionally, we show that manipulating embedding norms can have large effects on convergence speed. Our findings demonstrate that SSL embedding norms are integral to understanding and optimizing network behavior.
Persistent homology for high-dimensional data based on spectral methods
Nov 06, 2023


Persistent homology is a popular computational tool for detecting non-trivial topology of point clouds, such as the presence of loops or voids. However, many real-world datasets with low intrinsic dimensionality reside in an ambient space of much higher dimensionality. We show that in this case vanilla persistent homology becomes very sensitive to noise and fails to detect the correct topology. The same holds true for most existing refinements of persistent homology. As a remedy, we find that spectral distances on the $k$-nearest-neighbor graph of the data, such as diffusion distance and effective resistance, allow persistent homology to detect the correct topology even in the presence of high-dimensional noise. Furthermore, we derive a novel closed-form expression for effective resistance in terms of the eigendecomposition of the graph Laplacian, and describe its relation to diffusion distances. Finally, we apply these methods to several high-dimensional single-cell RNA-sequencing datasets and show that spectral distances on the $k$-nearest-neighbor graph allow robust detection of cell cycle loops.
Geometric Autoencoders -- What You See is What You Decode
Jun 30, 2023


Visualization is a crucial step in exploratory data analysis. One possible approach is to train an autoencoder with low-dimensional latent space. Large network depth and width can help unfolding the data. However, such expressive networks can achieve low reconstruction error even when the latent representation is distorted. To avoid such misleading visualizations, we propose first a differential geometric perspective on the decoder, leading to insightful diagnostics for an embedding's distortion, and second a new regularizer mitigating such distortion. Our ``Geometric Autoencoder'' avoids stretching the embedding spuriously, so that the visualization captures the data structure more faithfully. It also flags areas where little distortion could not be achieved, thus guarding against misinterpretation.
Contrastive learning unifies $t$-SNE and UMAP
Jun 03, 2022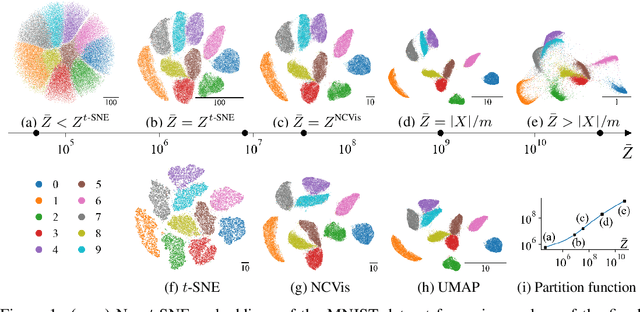
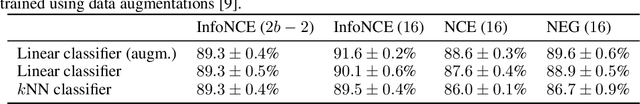
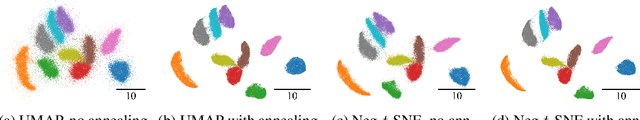
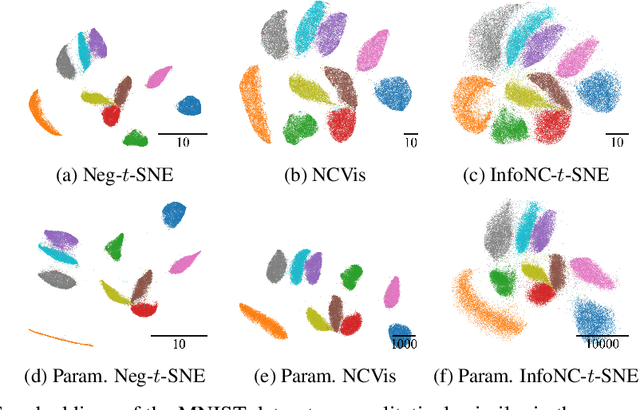
Neighbor embedding methods $t$-SNE and UMAP are the de facto standard for visualizing high-dimensional datasets. They appear to use very different loss functions with different motivations, and the exact relationship between them has been unclear. Here we show that UMAP is effectively negative sampling applied to the $t$-SNE loss function. We explain the difference between negative sampling and noise-contrastive estimation (NCE), which has been used to optimize $t$-SNE under the name NCVis. We prove that, unlike NCE, negative sampling learns a scaled data distribution. When applied in the neighbor embedding setting, it yields more compact embeddings with increased attraction, explaining differences in appearance between UMAP and $t$-SNE. Further, we generalize the notion of negative sampling and obtain a spectrum of embeddings, encompassing visualizations similar to $t$-SNE, NCVis, and UMAP. Finally, we explore the connection between representation learning in the SimCLR setting and neighbor embeddings, and show that (i) $t$-SNE can be optimized using the InfoNCE loss and in a parametric setting; (ii) various contrastive losses with only few noise samples can yield competitive performance in the SimCLR setup.
On UMAP's true loss function
Apr 22, 2021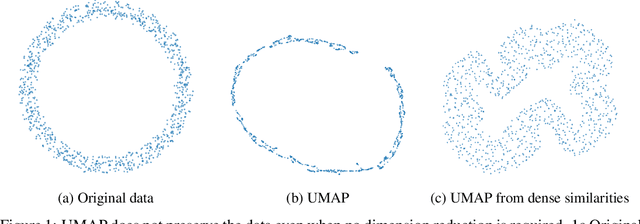
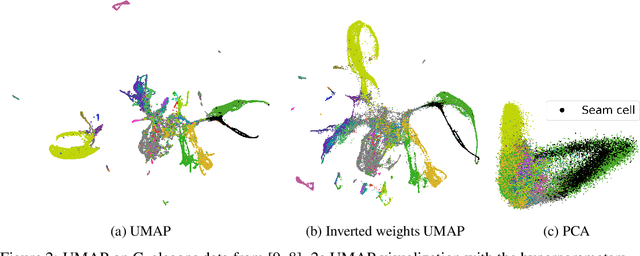
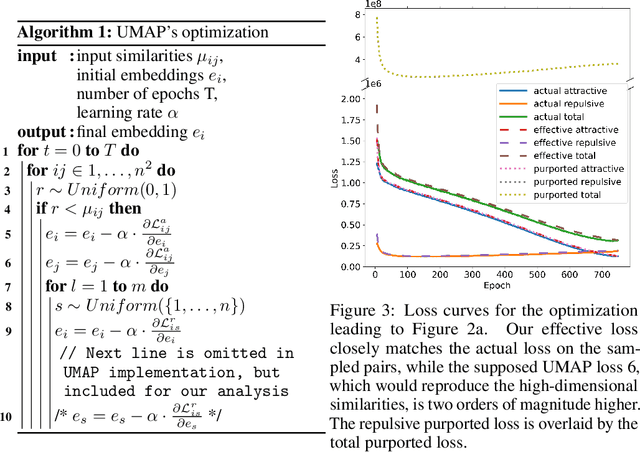
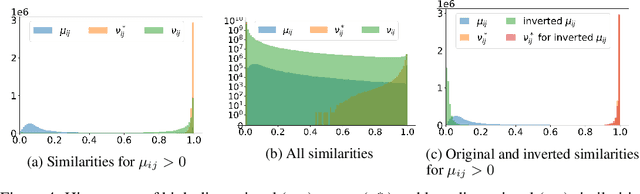
UMAP has supplanted t-SNE as state-of-the-art for visualizing high-dimensional datasets in many disciplines, but the reason for its success is not well understood. In this work, we investigate UMAP's sampling based optimization scheme in detail. We derive UMAP's effective loss function in closed form and find that it differs from the published one. As a consequence, we show that UMAP does not aim to reproduce its theoretically motivated high-dimensional UMAP similarities. Instead, it tries to reproduce similarities that only encode the shared $k$ nearest neighbor graph, thereby challenging the previous understanding of UMAP's effectiveness. Instead, we claim that the key to UMAP's success is its implicit balancing of attraction and repulsion resulting from negative sampling. This balancing in turn facilitates optimization via gradient descent. We corroborate our theoretical findings on toy and single cell RNA sequencing data.
Visualizing hierarchies in scRNA-seq data using a density tree-biased autoencoder
Feb 11, 2021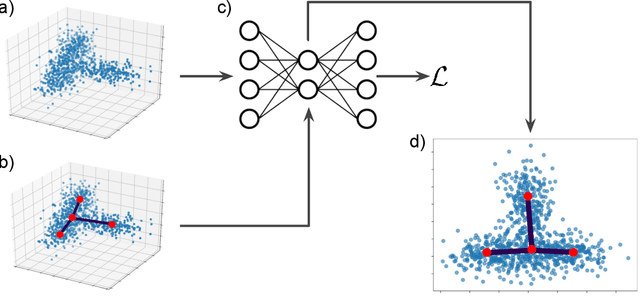
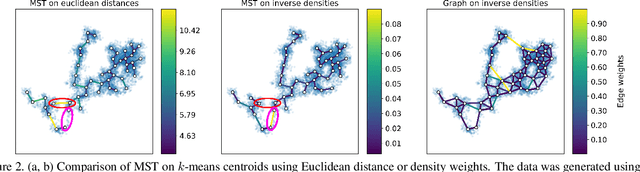
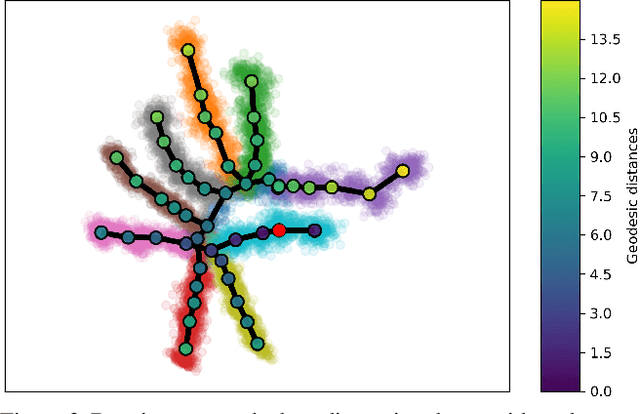
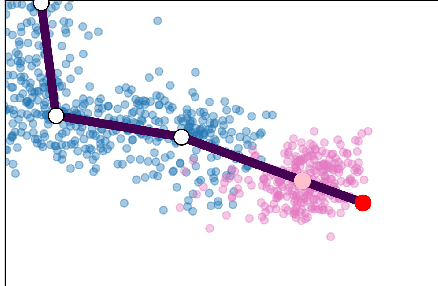
Single cell RNA sequencing (scRNA-seq) data makes studying the development of cells possible at unparalleled resolution. Given that many cellular differentiation processes are hierarchical, their scRNA-seq data is expected to be approximately tree-shaped in gene expression space. Inference and representation of this tree-structure in two dimensions is highly desirable for biological interpretation and exploratory analysis. Our two contributions are an approach for identifying a meaningful tree structure from high-dimensional scRNA-seq data, and a visualization method respecting the tree-structure. We extract the tree structure by means of a density based minimum spanning tree on a vector quantization of the data and show that it captures biological information well. We then introduce DTAE, a tree-biased autoencoder that emphasizes the tree structure of the data in low dimensional space. We compare to other dimension reduction methods and demonstrate the success of our method experimentally. Our implementation relying on PyTorch and Higra is available at github.com/hci-unihd/DTAE.
MultiStar: Instance Segmentation of Overlapping Objects with Star-Convex Polygons
Nov 26, 2020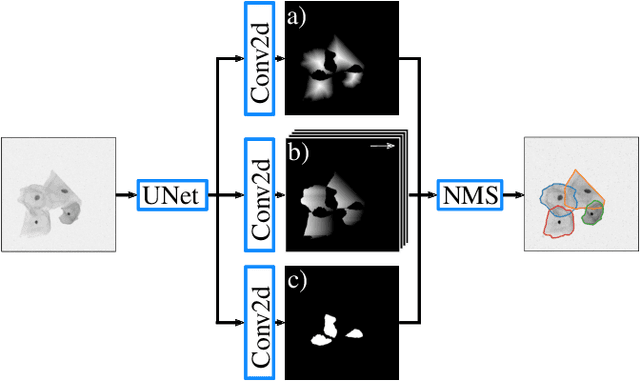
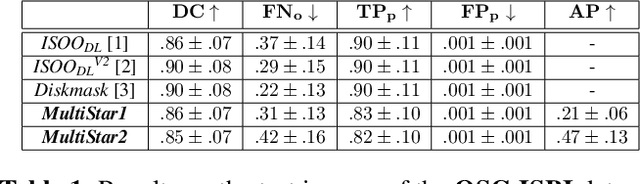
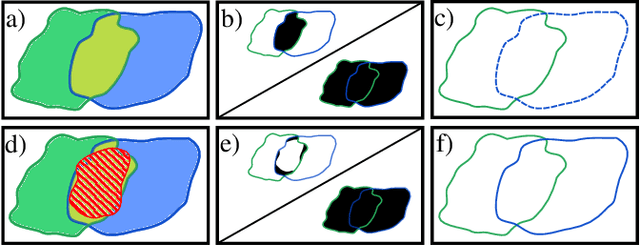
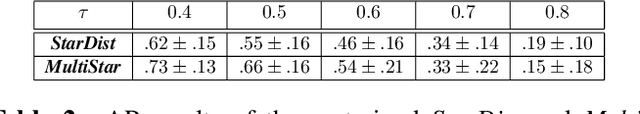
Instance segmentation of overlapping objects in biomedical images remains a largely unsolved problem. We take up this challenge and present MultiStar, an extension to the popular instance segmentation method StarDist. The key novelty of our method is that we identify pixels at which objects overlap and use this information to improve proposal sampling and to avoid suppressing proposals of truly overlapping objects. This allows us to apply the ideas of StarDist to images with overlapping objects, while incurring only a small overhead compared to the established method. MultiStar shows promising results on two datasets and has the advantage of using a simple and easy to train network architecture.
Probabilistic Watershed: Sampling all spanning forests for seeded segmentation and semi-supervised learning
Nov 06, 2019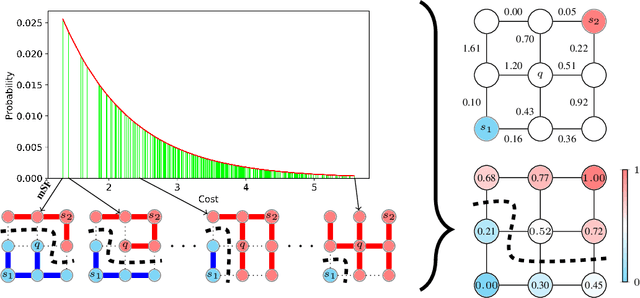
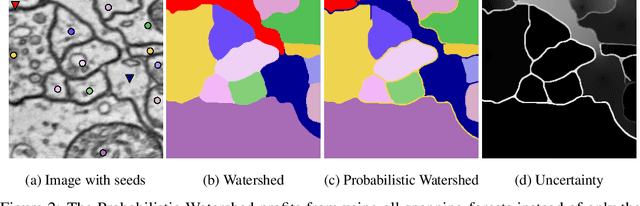
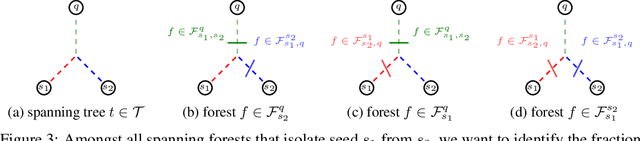
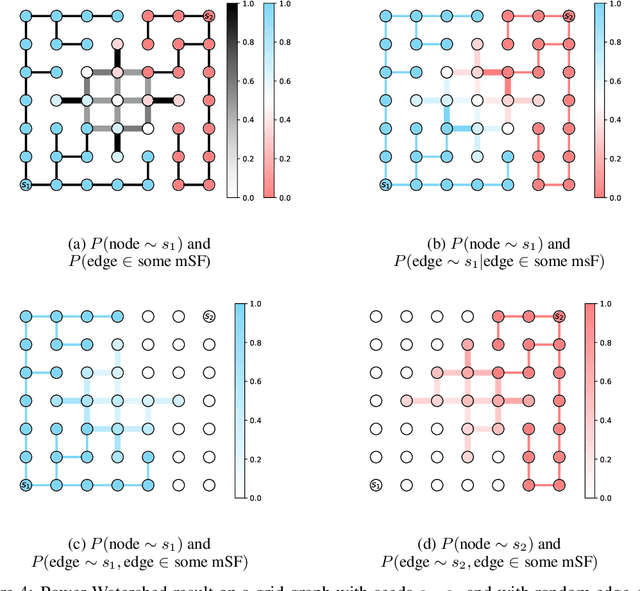
The seeded Watershed algorithm / minimax semi-supervised learning on a graph computes a minimum spanning forest which connects every pixel / unlabeled node to a seed / labeled node. We propose instead to consider all possible spanning forests and calculate, for every node, the probability of sampling a forest connecting a certain seed with that node. We dub this approach "Probabilistic Watershed". Leo Grady (2006) already noted its equivalence to the Random Walker / Harmonic energy minimization. We here give a simpler proof of this equivalence and establish the computational feasibility of the Probabilistic Watershed with Kirchhoff's matrix tree theorem. Furthermore, we show a new connection between the Random Walker probabilities and the triangle inequality of the effective resistance. Finally, we derive a new and intuitive interpretation of the Power Watershed.