 Add to Chrome
 Add to Firefox
 Add to Edge
Explainable Anatomy-Guided AI for Prostate MRI: Foundation Models and In Silico Clinical Trials for Virtual Biopsy-based Risk Assessment
May 23, 2025We present a fully automated, anatomically guided deep learning pipeline for prostate cancer (PCa) risk stratification using routine MRI. The pipeline integrates three key components: an nnU-Net module for segmenting the prostate gland and its zones on axial T2-weighted MRI; a classification module based on the UMedPT Swin Transformer foundation model, fine-tuned on 3D patches with optional anatomical priors and clinical data; and a VAE-GAN framework for generating counterfactual heatmaps that localize decision-driving image regions. The system was developed using 1,500 PI-CAI cases for segmentation and 617 biparametric MRIs with metadata from the CHAIMELEON challenge for classification (split into 70% training, 10% validation, and 20% testing). Segmentation achieved mean Dice scores of 0.95 (gland), 0.94 (peripheral zone), and 0.92 (transition zone). Incorporating gland priors improved AUC from 0.69 to 0.72, with a three-scale ensemble achieving top performance (AUC = 0.79, composite score = 0.76), outperforming the 2024 CHAIMELEON challenge winners. Counterfactual heatmaps reliably highlighted lesions within segmented regions, enhancing model interpretability. In a prospective multi-center in-silico trial with 20 clinicians, AI assistance increased diagnostic accuracy from 0.72 to 0.77 and Cohen's kappa from 0.43 to 0.53, while reducing review time per case by 40%. These results demonstrate that anatomy-aware foundation models with counterfactual explainability can enable accurate, interpretable, and efficient PCa risk assessment, supporting their potential use as virtual biopsies in clinical practice.
Interpreting multi-variate models with setPCA
Nov 17, 2021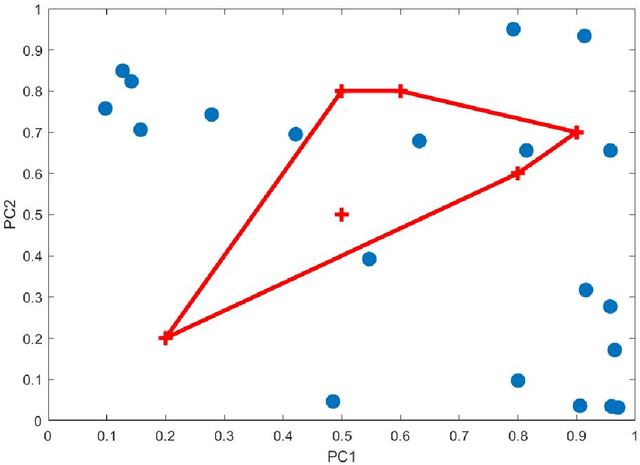
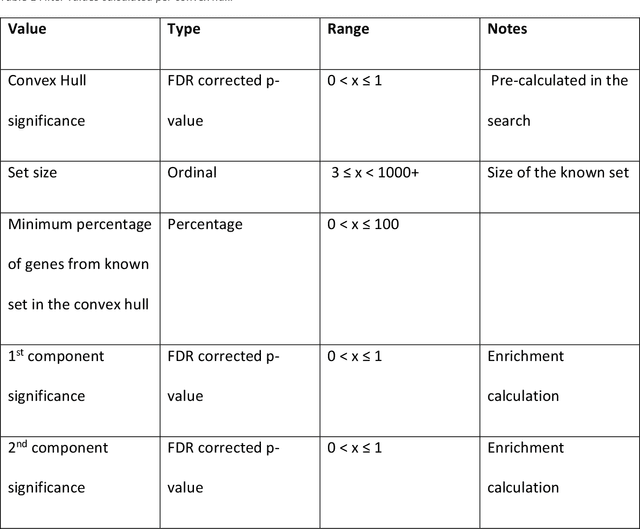
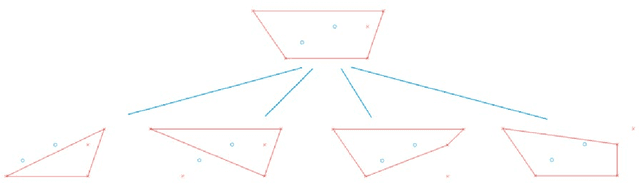
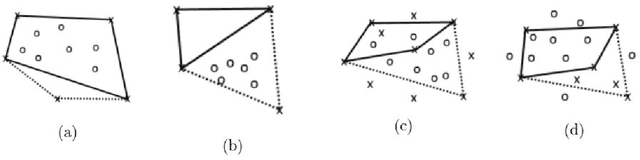
Principal Component Analysis (PCA) and other multi-variate models are often used in the analysis of "omics" data. These models contain much information which is currently neither easily accessible nor interpretable. Here we present an algorithmic method which has been developed to integrate this information with existing databases of background knowledge, stored in the form of known sets (for instance genesets or pathways). To make this accessible we have produced a Graphical User Interface (GUI) in Matlab which allows the overlay of known set information onto the loadings plot and thus improves the interpretability of the multi-variate model. For each known set the optimal convex hull, covering a subset of elements from the known set, is found through a search algorithm and displayed. In this paper we discuss two main topics; the details of the search algorithm for the optimal convex hull for this problem and the GUI interface which is freely available for download for academic use.