 Add to Chrome
 Add to Firefox
 Add to Edge
FUnc-SNE: A flexible, Fast, and Unconstrained algorithm for neighbour embeddings
Sep 09, 2025Neighbour embeddings (NE) allow the representation of high dimensional datasets into lower dimensional spaces and are often used in data visualisation. In practice, accelerated approximations are employed to handle very large datasets. Accelerating NE is challenging, and two main directions have been explored: very coarse approximations based on negative sampling (as in UMAP) achieve high effective speed but may lack quality in the extracted structures; less coarse approximations, as used in FIt-SNE or BH-t-SNE, offer better structure preservation at the cost of speed, while also restricting the target dimensionality to 2 or 3, limiting NE to visualisation. In some variants, the precision of these costlier accelerations also enables finer-grained control on the extracted structures through dedicated hyperparameters. This paper proposes to bridge the gab between both approaches by introducing a novel way to accelerate NE, requiring a small number of computations per iteration while maintaining good fine-grained structure preservation and flexibility through hyperparameter tuning, without limiting the dimensionality of the embedding space. The method was designed for interactive exploration of data; as such, it abandons the traditional two-phased approach of other NE methods, allowing instantaneous visual feedback when changing hyperparameters, even when these control processes happening on the high-dimensional side of the computations. Experiments using a publicly available, GPU accelerated GUI integration of the method show promising results in terms of speed, flexibility in the structures getting extracted, and show potential uses in broader machine learning contexts with minimal algorithmic modifications. Central to this algorithm is a novel approach to iterative approximate nearest neighbour search, which shows promising results compared to nearest neighbour descent.
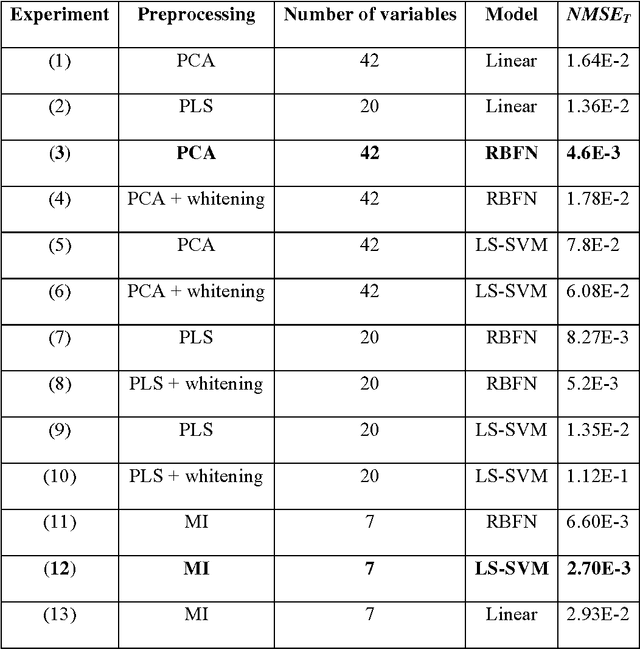
Electrode Selection for Noninvasive Fetal Electrocardiogram Extraction using Mutual Information Criteria
Feb 01, 2023Blind source separation (BSS) techniques have revealed to be promising approaches for, among other, biomedical signal processing applications. Specifically, for the noninvasive extraction of fetal cardiac signals from maternal abdominal recordings, where conventional filtering schemes have failed to extract the complete fetal ECG components. From previous studies, it is now believed that a carefully selected array of electrodes well-placed over the abdomen of a pregnant woman contains the required `information' for BSS, to extract the complete fetal components. Based on this idea, in previous works array recording systems and sensor selection strategies based on the Mutual Information (MI) criterion have been developed. In this paper the previous works have been extended, by considering the 3-dimensional aspects of the cardiac electrical activity. The proposed method has been tested on simulated and real maternal abdominal recordings. The results show that the new sensor selection strategy together with the MI criterion, can be effectively used to select the channels containing the most `information' concerning the fetal ECG components from an array of 72 recordings. The method is hence believed to be useful for the selection of the most informative channels in online applications, considering the different fetal positions and movements.
SQuadMDS: a lean Stochastic Quartet MDS improving global structure preservation in neighbor embedding like t-SNE and UMAP
Feb 24, 2022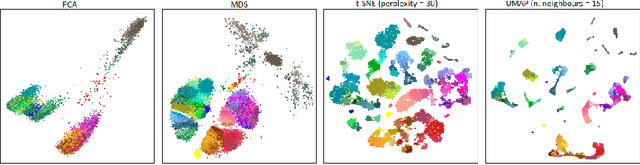
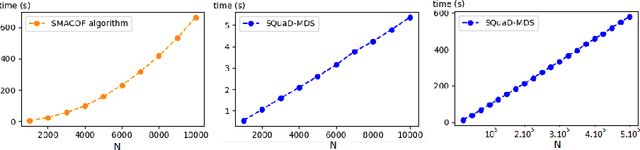
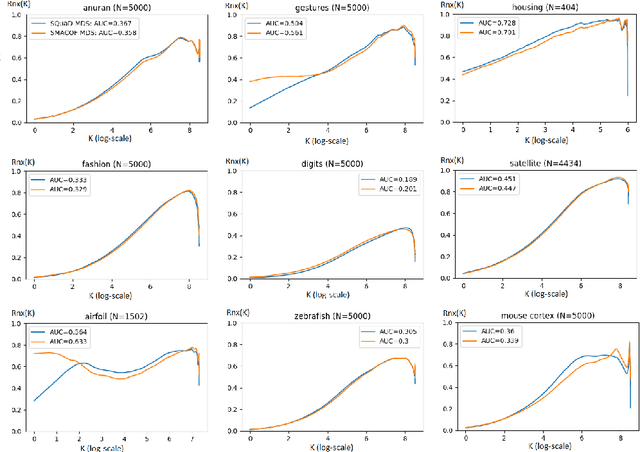
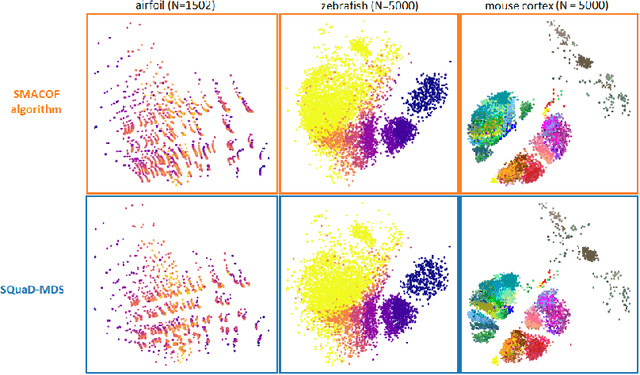
Multidimensional scaling is a statistical process that aims to embed high dimensional data into a lower-dimensional space; this process is often used for the purpose of data visualisation. Common multidimensional scaling algorithms tend to have high computational complexities, making them inapplicable on large data sets. This work introduces a stochastic, force directed approach to multidimensional scaling with a time and space complexity of O(N), with N data points. The method can be combined with force directed layouts of the family of neighbour embedding such as t-SNE, to produce embeddings that preserve both the global and the local structures of the data. Experiments assess the quality of the embeddings produced by the standalone version and its hybrid extension both quantitatively and qualitatively, showing competitive results outperforming state-of-the-art approaches. Codes are available at https://github.com/PierreLambert3/SQuaD-MDS-and-FItSNE-hybrid.
Perplexity-free Parametric t-SNE
Oct 03, 2020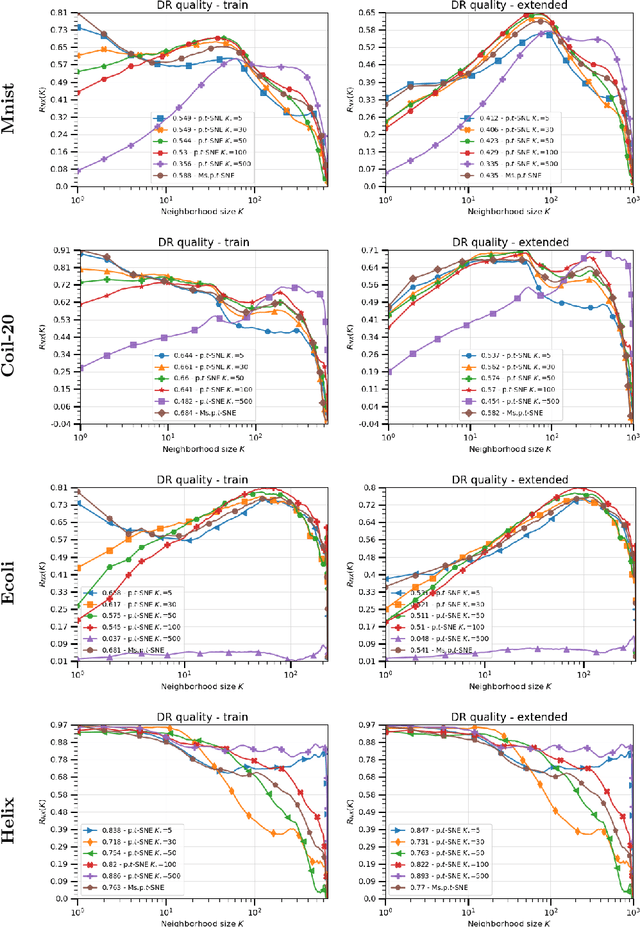
The t-distributed Stochastic Neighbor Embedding (t-SNE) algorithm is a ubiquitously employed dimensionality reduction (DR) method. Its non-parametric nature and impressive efficacy motivated its parametric extension. It is however bounded to a user-defined perplexity parameter, restricting its DR quality compared to recently developed multi-scale perplexity-free approaches. This paper hence proposes a multi-scale parametric t-SNE scheme, relieved from the perplexity tuning and with a deep neural network implementing the mapping. It produces reliable embeddings with out-of-sample extensions, competitive with the best perplexity adjustments in terms of neighborhood preservation on multiple data sets.
Advances in Feature Selection with Mutual Information
Sep 03, 2009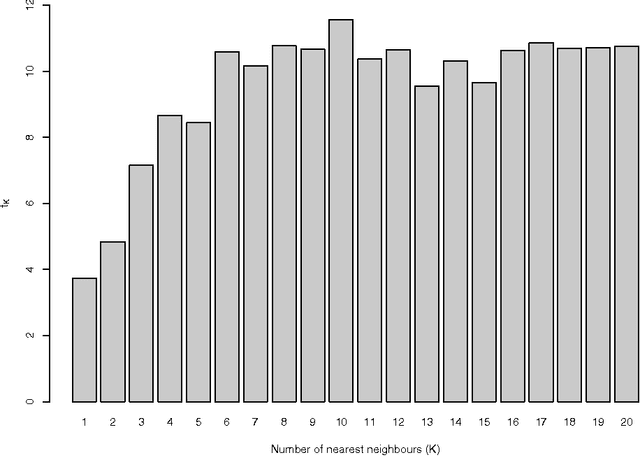
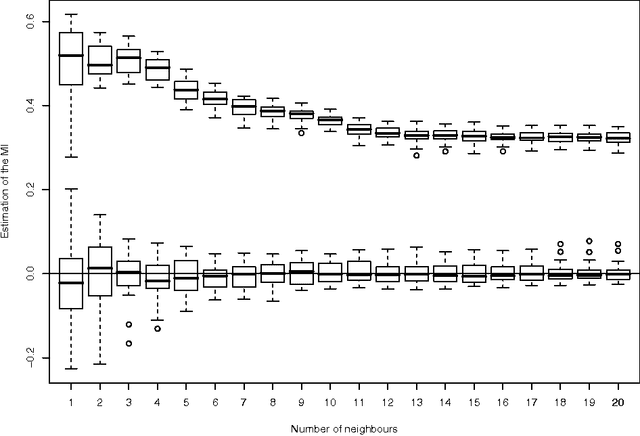
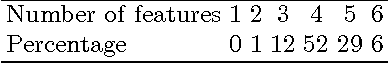
The selection of features that are relevant for a prediction or classification problem is an important problem in many domains involving high-dimensional data. Selecting features helps fighting the curse of dimensionality, improving the performances of prediction or classification methods, and interpreting the application. In a nonlinear context, the mutual information is widely used as relevance criterion for features and sets of features. Nevertheless, it suffers from at least three major limitations: mutual information estimators depend on smoothing parameters, there is no theoretically justified stopping criterion in the feature selection greedy procedure, and the estimation itself suffers from the curse of dimensionality. This chapter shows how to deal with these problems. The two first ones are addressed by using resampling techniques that provide a statistical basis to select the estimator parameters and to stop the search procedure. The third one is addressed by modifying the mutual information criterion into a measure of how features are complementary (and not only informative) for the problem at hand.
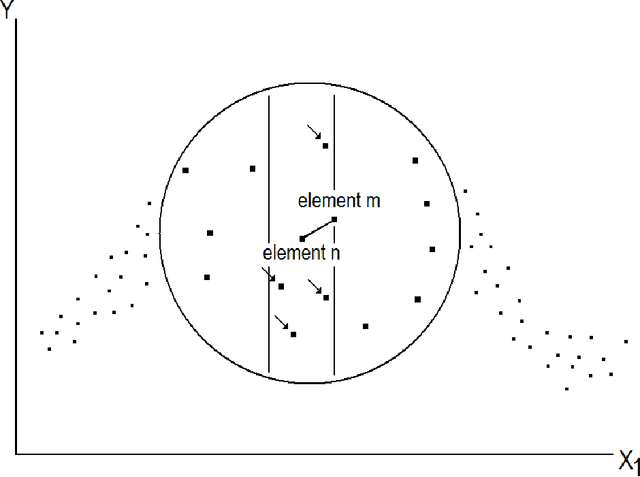
A data-driven functional projection approach for the selection of feature ranges in spectra with ICA or cluster analysis
Feb 03, 2008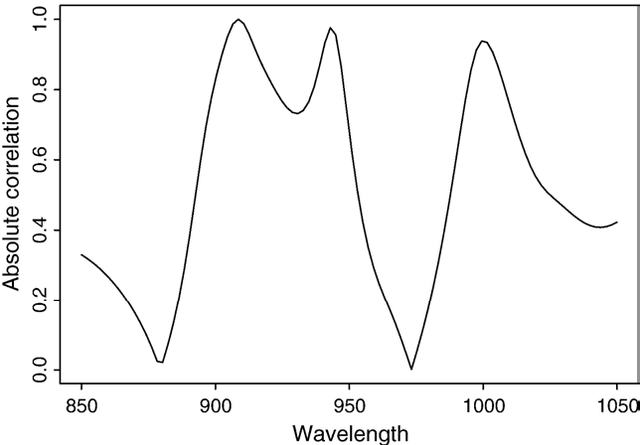
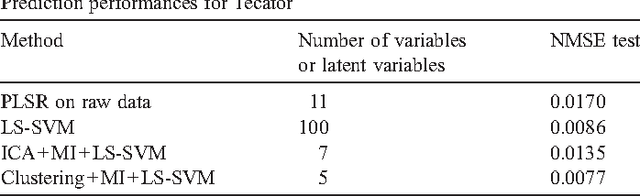
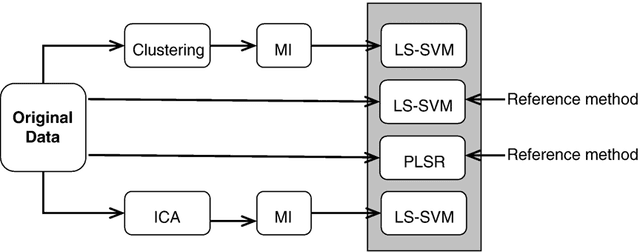
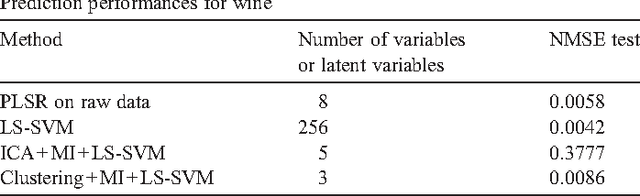
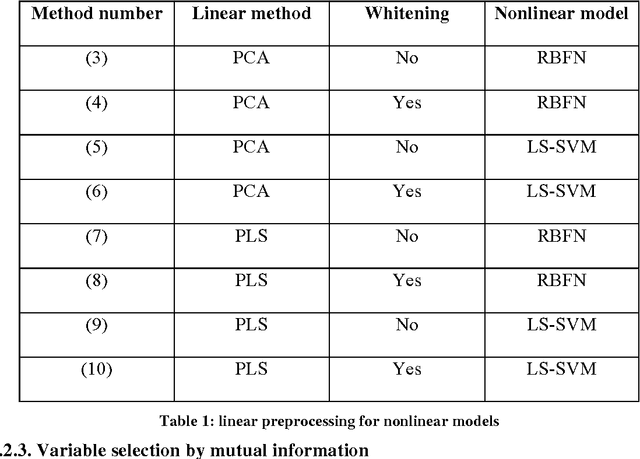
Prediction problems from spectra are largely encountered in chemometry. In addition to accurate predictions, it is often needed to extract information about which wavelengths in the spectra contribute in an effective way to the quality of the prediction. This implies to select wavelengths (or wavelength intervals), a problem associated to variable selection. In this paper, it is shown how this problem may be tackled in the specific case of smooth (for example infrared) spectra. The functional character of the spectra (their smoothness) is taken into account through a functional variable projection procedure. Contrarily to standard approaches, the projection is performed on a basis that is driven by the spectra themselves, in order to best fit their characteristics. The methodology is illustrated by two examples of functional projection, using Independent Component Analysis and functional variable clustering, respectively. The performances on two standard infrared spectra benchmarks are illustrated.
* A paraitre
Representation of Functional Data in Neural Networks
Sep 23, 2007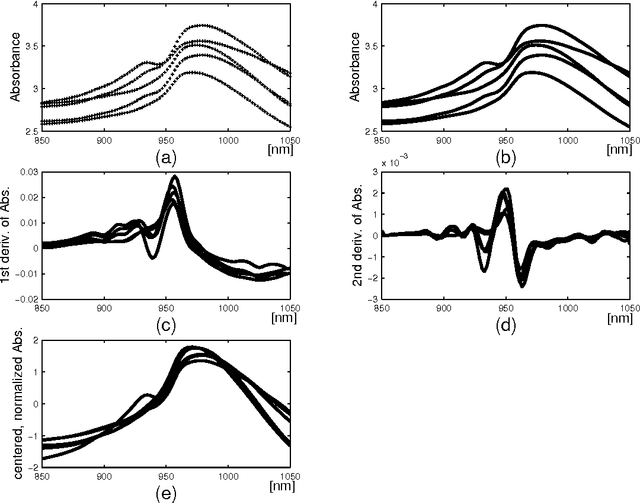
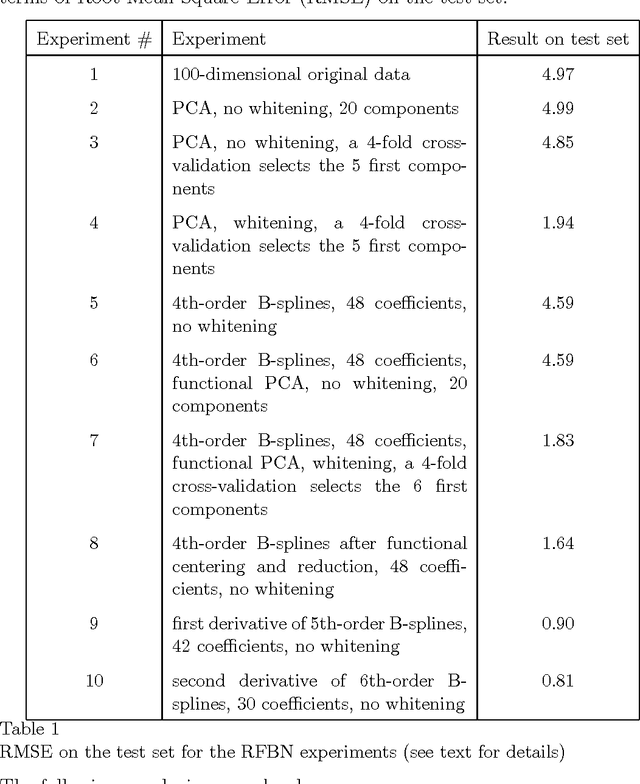
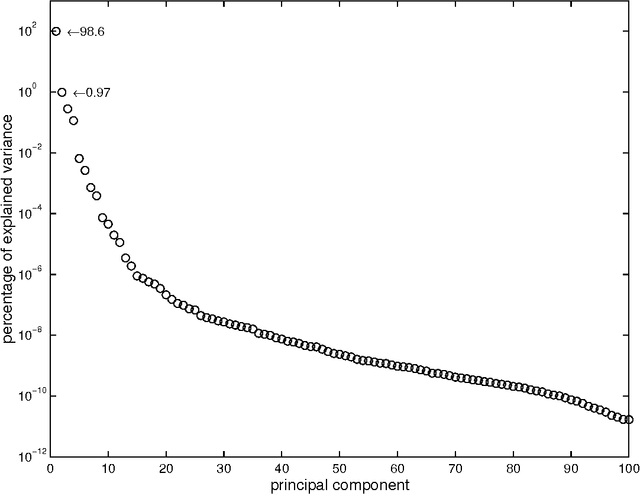
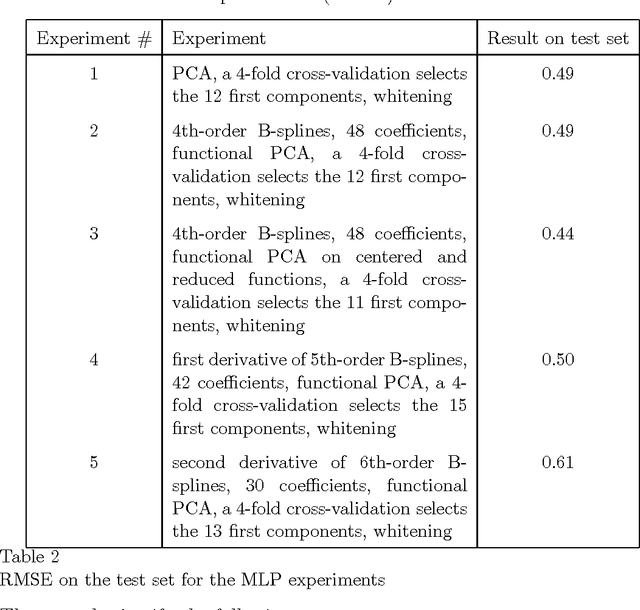
Functional Data Analysis (FDA) is an extension of traditional data analysis to functional data, for example spectra, temporal series, spatio-temporal images, gesture recognition data, etc. Functional data are rarely known in practice; usually a regular or irregular sampling is known. For this reason, some processing is needed in order to benefit from the smooth character of functional data in the analysis methods. This paper shows how to extend the Radial-Basis Function Networks (RBFN) and Multi-Layer Perceptron (MLP) models to functional data inputs, in particular when the latter are known through lists of input-output pairs. Various possibilities for functional processing are discussed, including the projection on smooth bases, Functional Principal Component Analysis, functional centering and reduction, and the use of differential operators. It is shown how to incorporate these functional processing into the RBFN and MLP models. The functional approach is illustrated on a benchmark of spectrometric data analysis.
* Also available online from: http://www.sciencedirect.com/science/journal/09252312
Resampling methods for parameter-free and robust feature selection with mutual information
Sep 23, 2007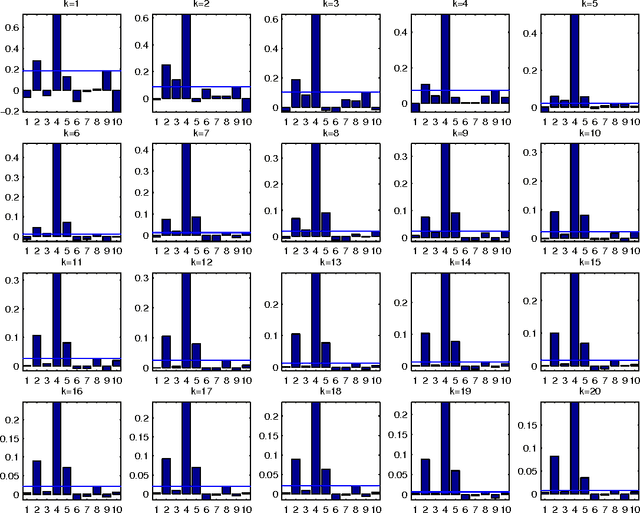
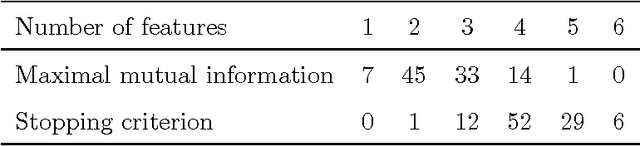
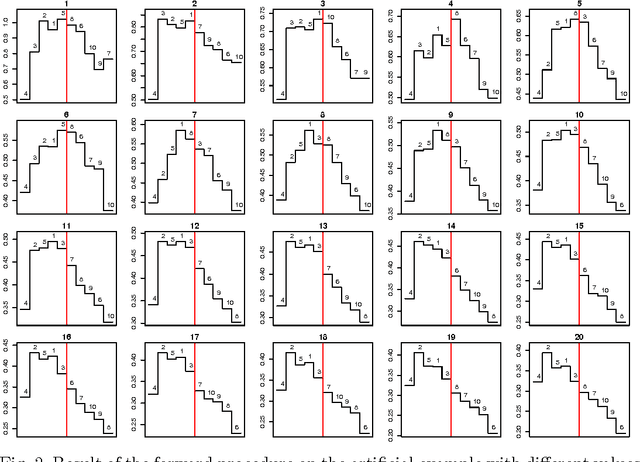
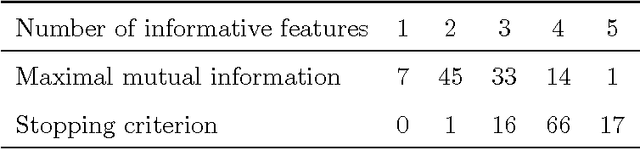
Combining the mutual information criterion with a forward feature selection strategy offers a good trade-off between optimality of the selected feature subset and computation time. However, it requires to set the parameter(s) of the mutual information estimator and to determine when to halt the forward procedure. These two choices are difficult to make because, as the dimensionality of the subset increases, the estimation of the mutual information becomes less and less reliable. This paper proposes to use resampling methods, a K-fold cross-validation and the permutation test, to address both issues. The resampling methods bring information about the variance of the estimator, information which can then be used to automatically set the parameter and to calculate a threshold to stop the forward procedure. The procedure is illustrated on a synthetic dataset as well as on real-world examples.
Fast Selection of Spectral Variables with B-Spline Compression
Sep 23, 2007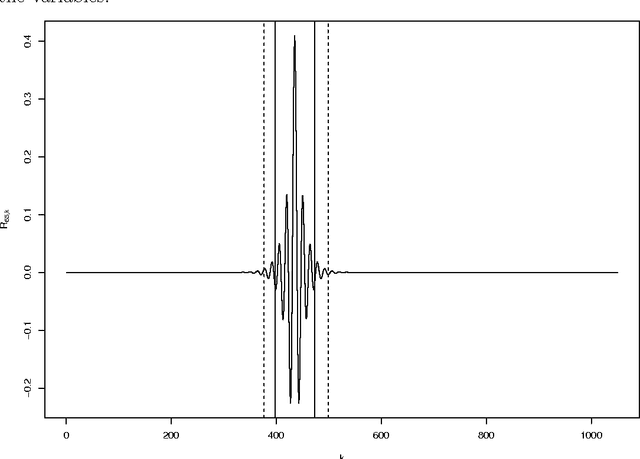
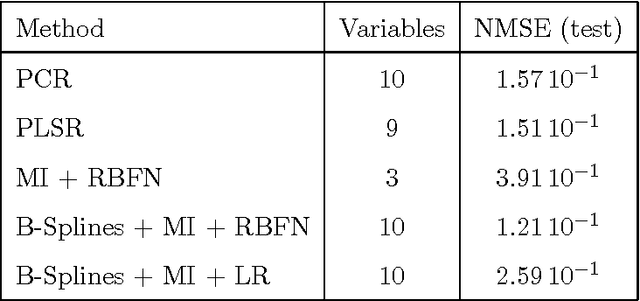
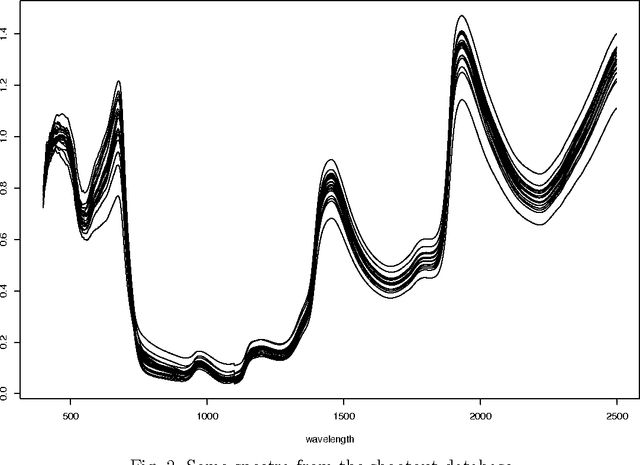
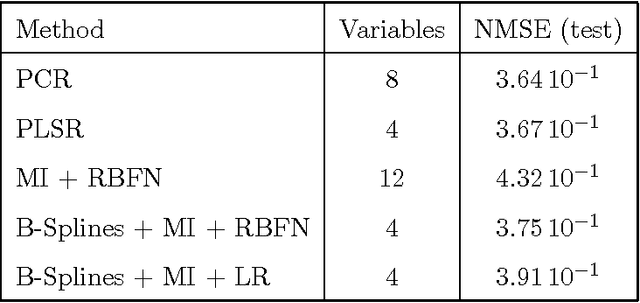
The large number of spectral variables in most data sets encountered in spectral chemometrics often renders the prediction of a dependent variable uneasy. The number of variables hopefully can be reduced, by using either projection techniques or selection methods; the latter allow for the interpretation of the selected variables. Since the optimal approach of testing all possible subsets of variables with the prediction model is intractable, an incremental selection approach using a nonparametric statistics is a good option, as it avoids the computationally intensive use of the model itself. It has two drawbacks however: the number of groups of variables to test is still huge, and colinearities can make the results unstable. To overcome these limitations, this paper presents a method to select groups of spectral variables. It consists in a forward-backward procedure applied to the coefficients of a B-Spline representation of the spectra. The criterion used in the forward-backward procedure is the mutual information, allowing to find nonlinear dependencies between variables, on the contrary of the generally used correlation. The spline representation is used to get interpretability of the results, as groups of consecutive spectral variables will be selected. The experiments conducted on NIR spectra from fescue grass and diesel fuels show that the method provides clearly identified groups of selected variables, making interpretation easy, while keeping a low computational load. The prediction performances obtained using the selected coefficients are higher than those obtained by the same method applied directly to the original variables and similar to those obtained using traditional models, although using significantly less spectral variables.
Mutual information for the selection of relevant variables in spectrometric nonlinear modelling
Sep 21, 2007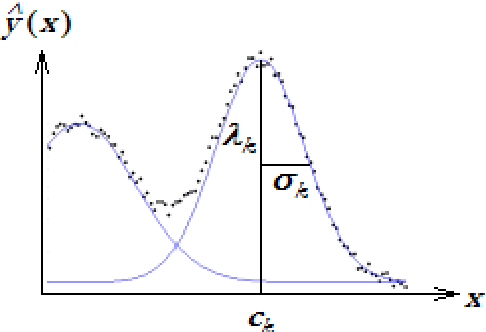
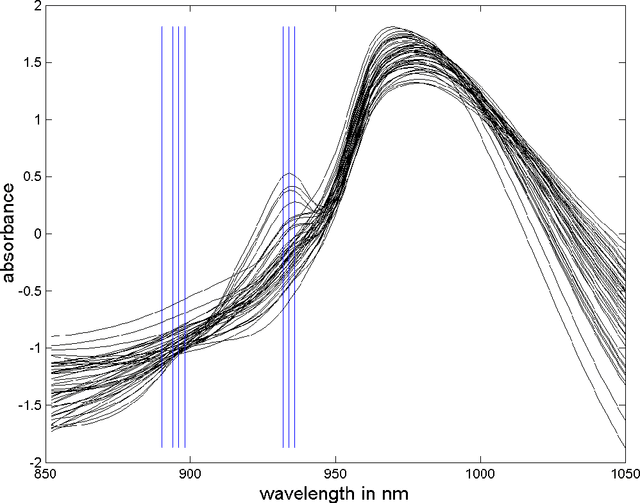
Data from spectrophotometers form vectors of a large number of exploitable variables. Building quantitative models using these variables most often requires using a smaller set of variables than the initial one. Indeed, a too large number of input variables to a model results in a too large number of parameters, leading to overfitting and poor generalization abilities. In this paper, we suggest the use of the mutual information measure to select variables from the initial set. The mutual information measures the information content in input variables with respect to the model output, without making any assumption on the model that will be used; it is thus suitable for nonlinear modelling. In addition, it leads to the selection of variables among the initial set, and not to linear or nonlinear combinations of them. Without decreasing the model performances compared to other variable projection methods, it allows therefore a greater interpretability of the results.