 Add to Chrome
 Add to Firefox
 Add to Edge
Do VLMs Truly "Read" Candlesticks? A Multi-Scale Benchmark for Visual Stock Price Forecasting
Apr 14, 2026Vision-language models(VLMs) are increasingly applied to visual stock price forecasting, yet existing benchmarks inadequately evaluate their understanding of stock price in candlestick charts. First, prior studies fail to isolate VLMs' comprehension of visual inputs genuinely improves predictive performance and whether VLMs truly comprehend candlestick patterns. Further, most existing datasets and evaluation setups are designed around single-period or tabular inputs. However, human analysts strongly rely on multi-scale candlestick charts, where longer-term horizons capture trend direction and shorter-term horizons provide cues for inflection points, making it difficult to systematically assess VLMs' ability to integrate short-term and long-term visual market dynamics. To bridge this gap, we construct a multi-scale candlestick charts dataset and a standardized evaluation framework to assess VLMs' ability to utilize multi-scale visual market signals. Evaluation combines confusion-matrix-based diagnostics with information coefficient(IC) time series metrics and includes XGBoost as a feature-based temporal baseline. Using this dataset, we benchmark representative VLMs and analyze their ability to leverage multi-scale stock price data. Experimental results show that most VLMs perform well only under persistent uptrend or downtrend conditions, while exhibiting weak predictive capability in more common market scenarios. We also identify significant prediction biases and limited sensitivity to explicitly specified forecast horizons in prompts, indicating inherent limitations in precise temporal reasoning.
C2P2: A Collective Cryptocurrency Up/Down Price Prediction Engine
Jun 03, 2019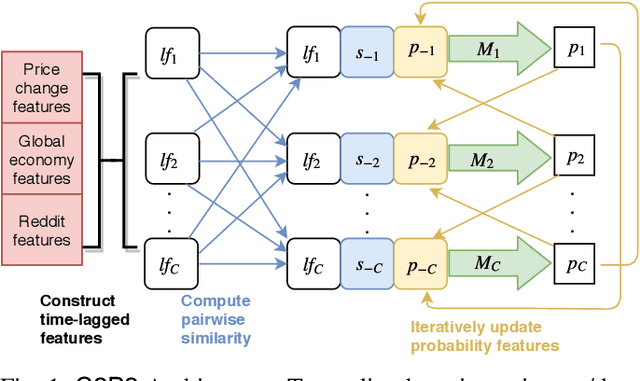
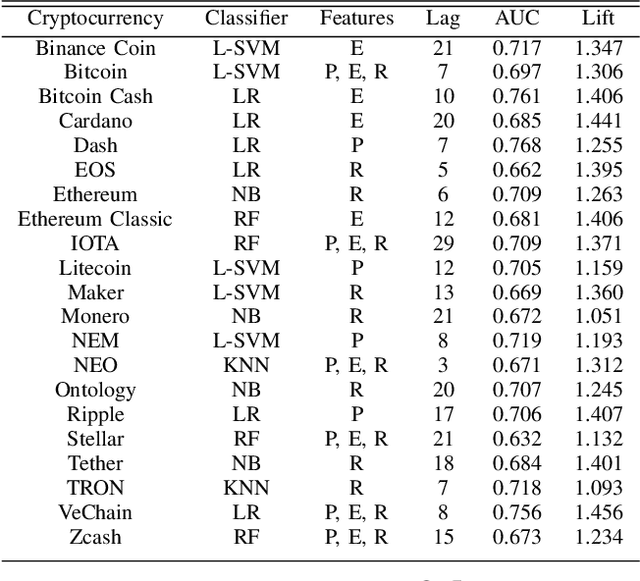
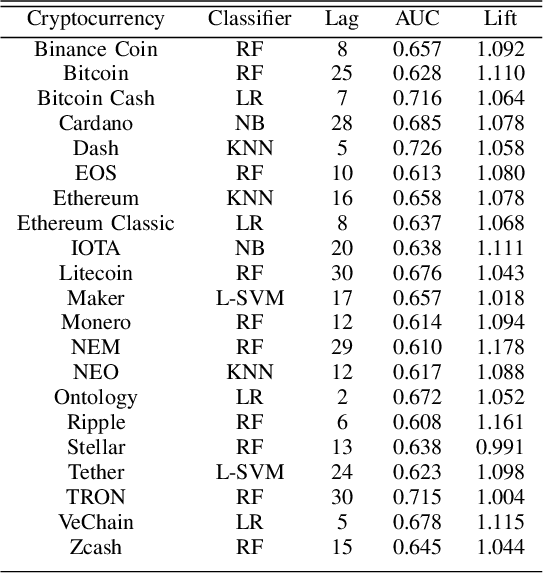
We study the problem of predicting whether the price of the 21 most popular cryptocurrencies (according to coinmarketcap.com) will go up or down on day d, using data up to day d-1. Our C2P2 algorithm is the first algorithm to consider the fact that the price of a cryptocurrency c might depend not only on historical prices, sentiments, global stock indices, but also on the prices and predicted prices of other cryptocurrencies. C2P2 therefore does not predict cryptocurrency prices one coin at a time --- rather it uses similarity metrics in conjunction with collective classification to compare multiple cryptocurrency features to jointly predict the cryptocurrency prices for all 21 coins considered. We show that our C2P2 algorithm beats out a recent competing 2017 paper by margins varying from 5.1-83% and another Bitcoin-specific prediction paper from 2018 by 16%. In both cases, C2P2 is the winner on all cryptocurrencies considered. Moreover, we experimentally show that the use of similarity metrics within our C2P2 algorithm leads to a direct improvement for 20 out of 21 cryptocurrencies ranging from 0.4% to 17.8%. Without the similarity component, C2P2 still beats competitors on 20 out of 21 cryptocurrencies considered. We show that all these results are statistically significant via a Student's t-test with p<1e-5. Check our demo at https://www.cs.dartmouth.edu/dsail/demos/c2p2