 Add to Chrome
 Add to Firefox
 Add to Edge
Compressive Embedding and Visualization using Graphs
Feb 19, 2017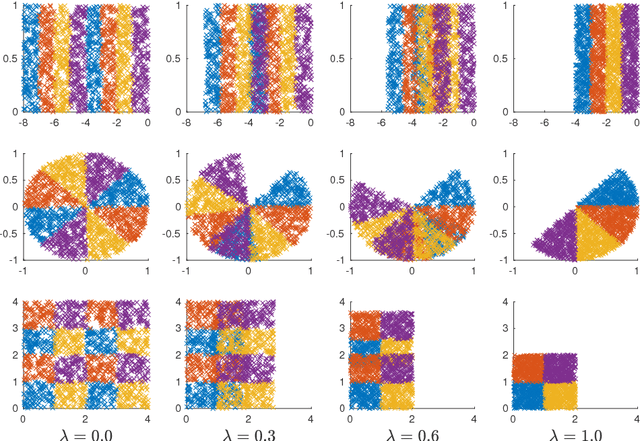
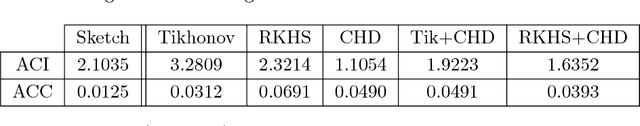
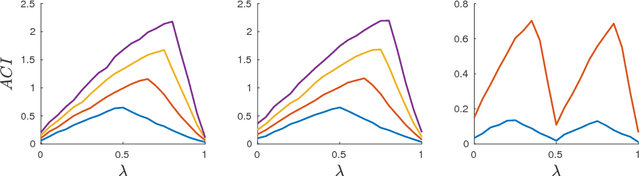
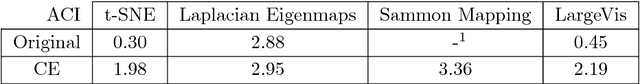
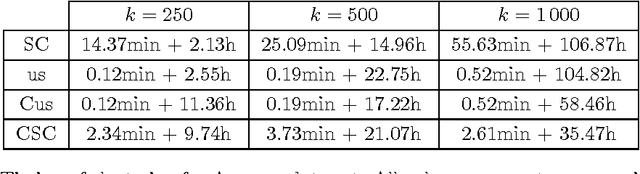
Visualizing high-dimensional data has been a focus in data analysis communities for decades, which has led to the design of many algorithms, some of which are now considered references (such as t-SNE for example). In our era of overwhelming data volumes, the scalability of such methods have become more and more important. In this work, we present a method which allows to apply any visualization or embedding algorithm on very large datasets by considering only a fraction of the data as input and then extending the information to all data points using a graph encoding its global similarity. We show that in most cases, using only $\mathcal{O}(\log(N))$ samples is sufficient to diffuse the information to all $N$ data points. In addition, we propose quantitative methods to measure the quality of embeddings and demonstrate the validity of our technique on both synthetic and real-world datasets.
Fast Eigenspace Approximation using Random Signals
Nov 04, 2016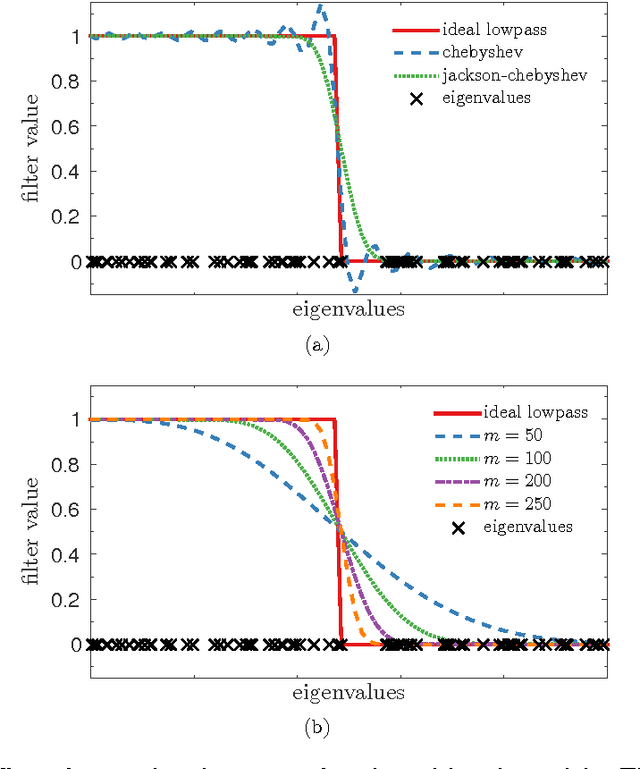
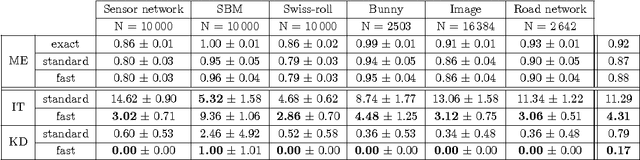
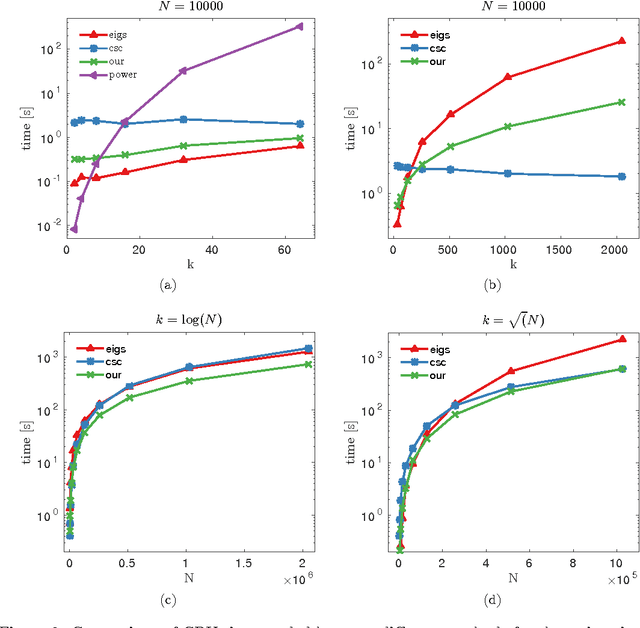
We focus in this work on the estimation of the first $k$ eigenvectors of any graph Laplacian using filtering of Gaussian random signals. We prove that we only need $k$ such signals to be able to exactly recover as many of the smallest eigenvectors, regardless of the number of nodes in the graph. In addition, we address key issues in implementing the theoretical concepts in practice using accurate approximated methods. We also propose fast algorithms both for eigenspace approximation and for the determination of the $k$th smallest eigenvalue $\lambda_k$. The latter proves to be extremely efficient under the assumption of locally uniform distribution of the eigenvalue over the spectrum. Finally, we present experiments which show the validity of our method in practice and compare it to state-of-the-art methods for clustering and visualization both on synthetic small-scale datasets and larger real-world problems of millions of nodes. We show that our method allows a better scaling with the number of nodes than all previous methods while achieving an almost perfect reconstruction of the eigenspace formed by the first $k$ eigenvectors.
Graph-based denoising for time-varying point clouds
Nov 16, 2015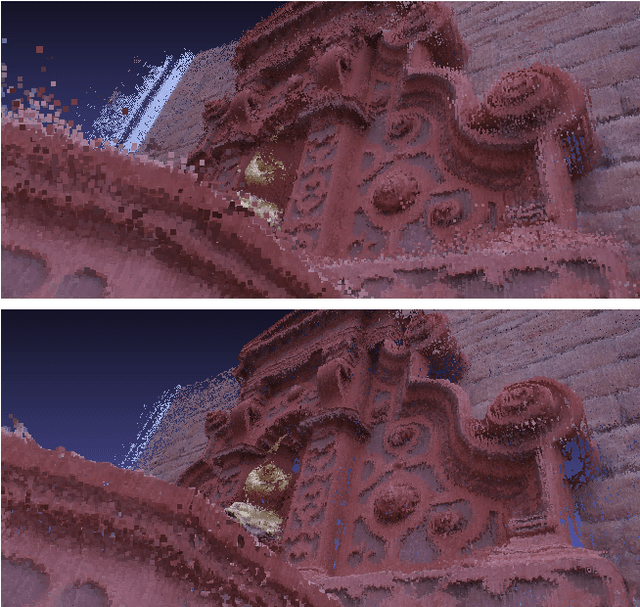
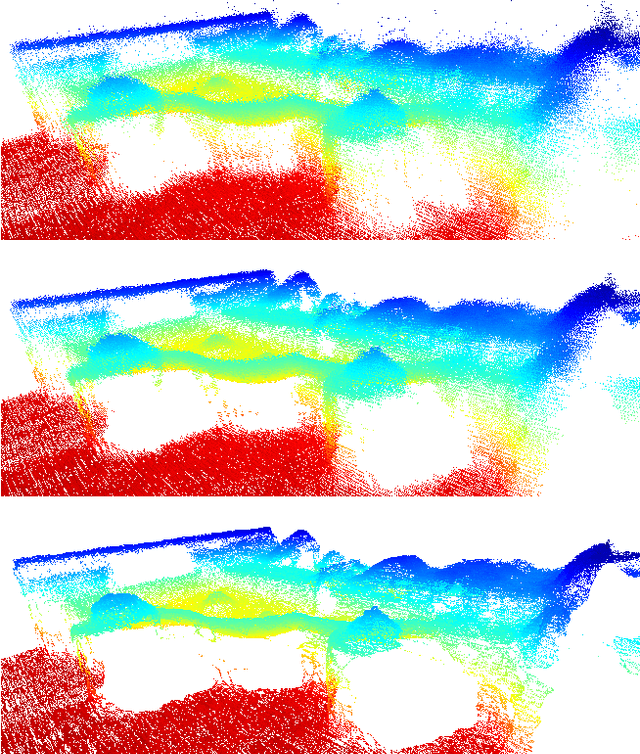
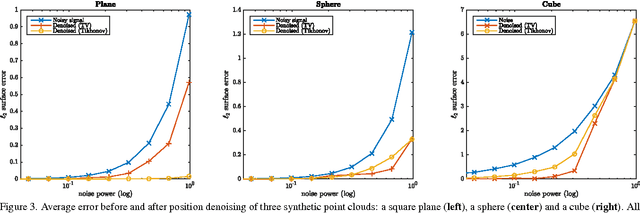
Noisy 3D point clouds arise in many applications. They may be due to errors when constructing a 3D model from images or simply to imprecise depth sensors. Point clouds can be given geometrical structure using graphs created from the similarity information between points. This paper introduces a technique that uses this graph structure and convex optimization methods to denoise 3D point clouds. A short discussion presents how those methods naturally generalize to time-varying inputs such as 3D point cloud time series.
* 4 pages, 3 figures, 3DTV-Con 2015