 Add to Chrome
 Add to Firefox
 Add to Edge
Manifold Interpolating Optimal-Transport Flows for Trajectory Inference
Jun 29, 2022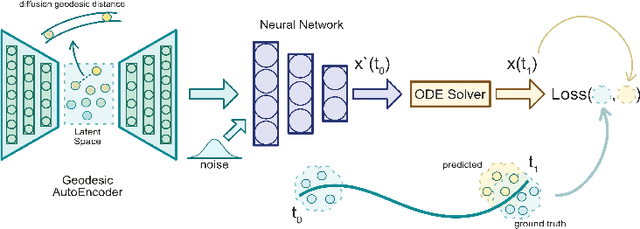
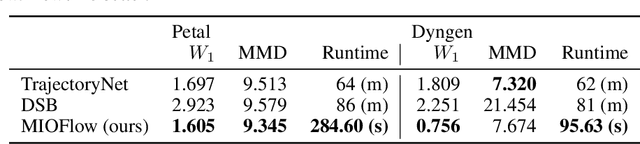
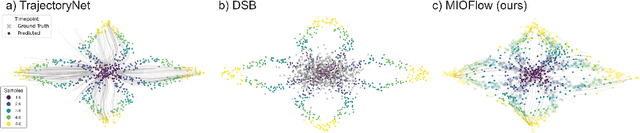
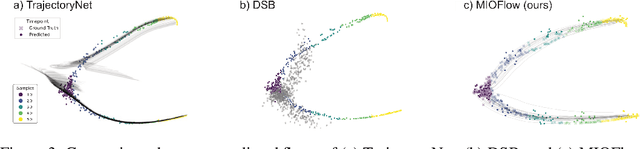
Here, we present a method called Manifold Interpolating Optimal-Transport Flow (MIOFlow) that learns stochastic, continuous population dynamics from static snapshot samples taken at sporadic timepoints. MIOFlow combines dynamic models, manifold learning, and optimal transport by training neural ordinary differential equations (Neural ODE) to interpolate between static population snapshots as penalized by optimal transport with manifold ground distance. Further, we ensure that the flow follows the geometry by operating in the latent space of an autoencoder that we call a geodesic autoencoder (GAE). In GAE the latent space distance between points is regularized to match a novel multiscale geodesic distance on the data manifold that we define. We show that this method is superior to normalizing flows, Schr\"odinger bridges and other generative models that are designed to flow from noise to data in terms of interpolating between populations. Theoretically, we link these trajectories with dynamic optimal transport. We evaluate our method on simulated data with bifurcations and merges, as well as scRNA-seq data from embryoid body differentiation, and acute myeloid leukemia treatment.
Long Range Graph Benchmark
Jun 16, 2022
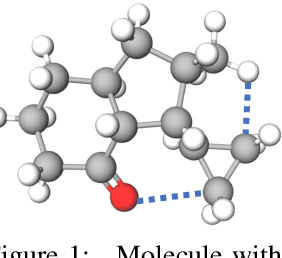
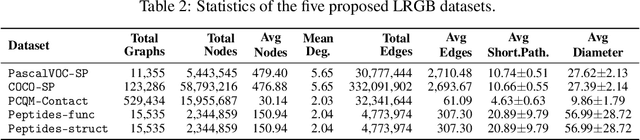
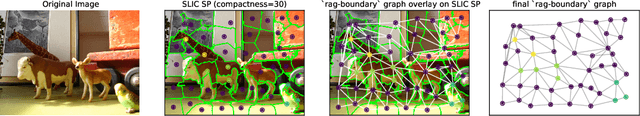
Graph Neural Networks (GNNs) that are based on the message passing (MP) paradigm exchange information between 1-hop neighbors to build node representations at each layer. In principle, such networks are not able to capture long-range interactions (LRI) that may be desired or necessary for learning a given task on graphs. Recently, there has been an increasing interest in development of Transformer-based methods for graphs that can consider full node connectivity beyond the original sparse structure, thus enabling the modeling of LRI. However, MP-GNNs that simply rely on 1-hop message passing often fare better in several existing graph benchmarks when combined with positional feature representations, among other innovations, hence limiting the perceived utility and ranking of Transformer-like architectures. Here, we present the Long Range Graph Benchmark (LRGB) with 5 graph learning datasets: PascalVOC-SP, COCO-SP, PCQM-Contact, Peptides-func and Peptides-struct that arguably require LRI reasoning to achieve strong performance in a given task. We benchmark both baseline GNNs and Graph Transformer networks to verify that the models which capture long-range dependencies perform significantly better on these tasks. Therefore, these datasets are suitable for benchmarking and exploration of MP-GNNs and Graph Transformer architectures that are intended to capture LRI.
Taxonomy of Benchmarks in Graph Representation Learning
Jun 15, 2022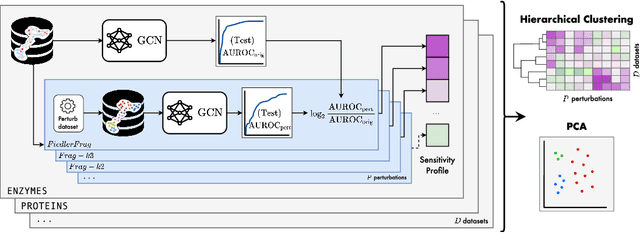
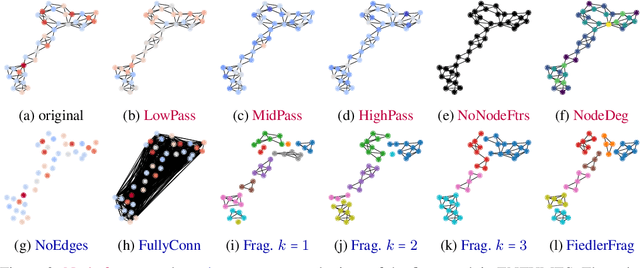
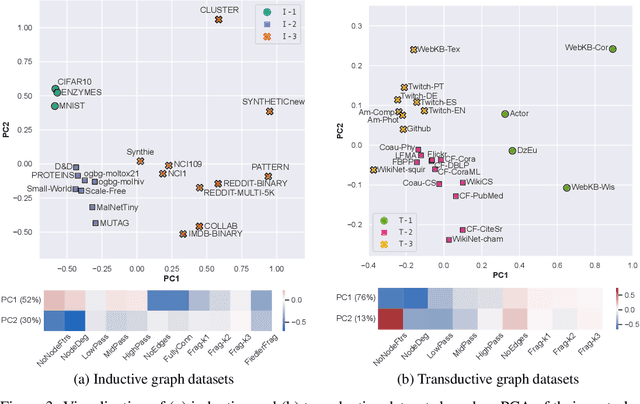
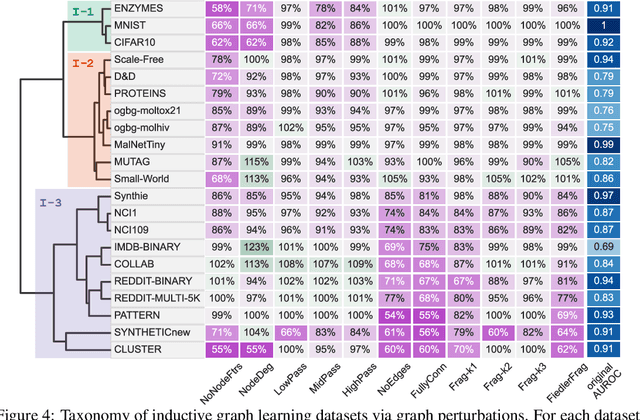
Graph Neural Networks (GNNs) extend the success of neural networks to graph-structured data by accounting for their intrinsic geometry. While extensive research has been done on developing GNN models with superior performance according to a collection of graph representation learning benchmarks, it is currently not well understood what aspects of a given model are probed by them. For example, to what extent do they test the ability of a model to leverage graph structure vs. node features? Here, we develop a principled approach to taxonomize benchmarking datasets according to a $\textit{sensitivity profile}$ that is based on how much GNN performance changes due to a collection of graph perturbations. Our data-driven analysis provides a deeper understanding of which benchmarking data characteristics are leveraged by GNNs. Consequently, our taxonomy can aid in selection and development of adequate graph benchmarks, and better informed evaluation of future GNN methods. Finally, our approach and implementation in $\texttt{GTaxoGym}$ package are extendable to multiple graph prediction task types and future datasets.
Diffusion Transport Alignment
Jun 15, 2022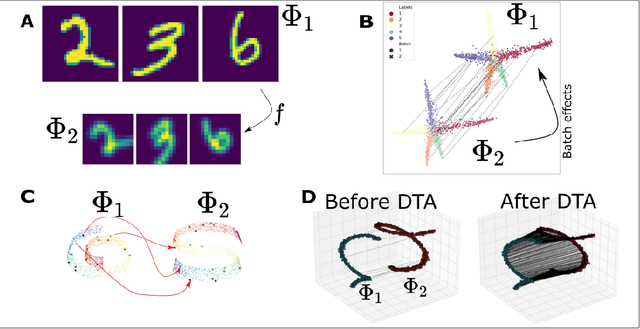
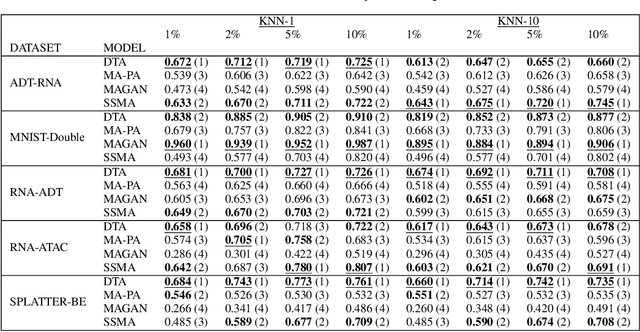
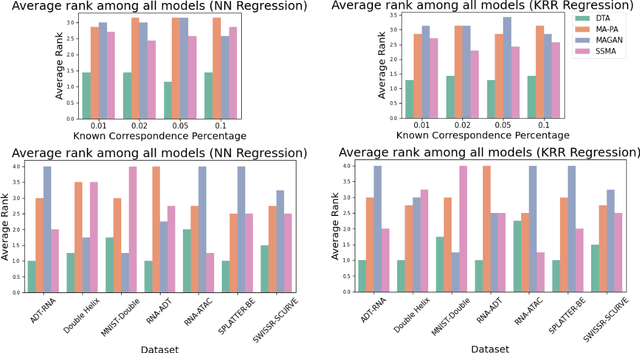
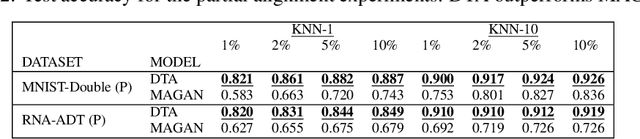
The integration of multimodal data presents a challenge in cases when the study of a given phenomena by different instruments or conditions generates distinct but related domains. Many existing data integration methods assume a known one-to-one correspondence between domains of the entire dataset, which may be unrealistic. Furthermore, existing manifold alignment methods are not suited for cases where the data contains domain-specific regions, i.e., there is not a counterpart for a certain portion of the data in the other domain. We propose Diffusion Transport Alignment (DTA), a semi-supervised manifold alignment method that exploits prior correspondence knowledge between only a few points to align the domains. By building a diffusion process, DTA finds a transportation plan between data measured from two heterogeneous domains with different feature spaces, which by assumption, share a similar geometrical structure coming from the same underlying data generating process. DTA can also compute a partial alignment in a data-driven fashion, resulting in accurate alignments when some data are measured in only one domain. We empirically demonstrate that DTA outperforms other methods in aligning multimodal data in this semisupervised setting. We also empirically show that the alignment obtained by DTA can improve the performance of machine learning tasks, such as domain adaptation, inter-domain feature mapping, and exploratory data analysis, while outperforming competing methods.
Can Hybrid Geometric Scattering Networks Help Solve the Maximal Clique Problem?
Jun 03, 2022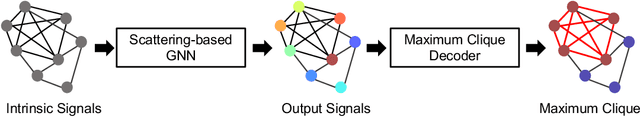
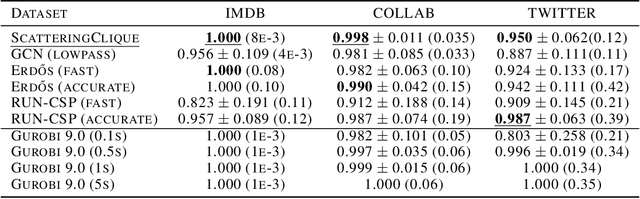
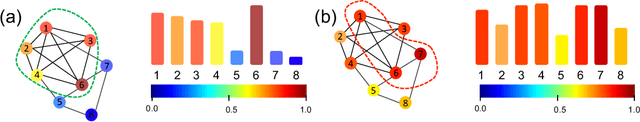
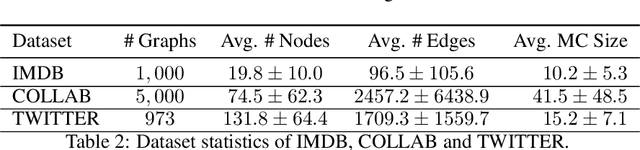
We propose a geometric scattering-based graph neural network (GNN) for approximating solutions of the NP-hard maximal clique (MC) problem. We construct a loss function with two terms, one which encourages the network to find a large set of nodes and the other which acts as a surrogate for the constraint that the nodes form a clique. We then use this loss to train a novel GNN architecture that outputs a vector representing the probability for each node to be part of the MC and apply a rule-based decoder to make our final prediction. The incorporation of the scattering transform alleviates the so-called oversmoothing problem that is often encountered in GNNs and would degrade the performance of our proposed setup. Our empirical results demonstrate that our method outperforms representative GNN baselines in terms of solution accuracy and inference speed as well as conventional solvers like GUROBI with limited time budgets.
Recipe for a General, Powerful, Scalable Graph Transformer
May 25, 2022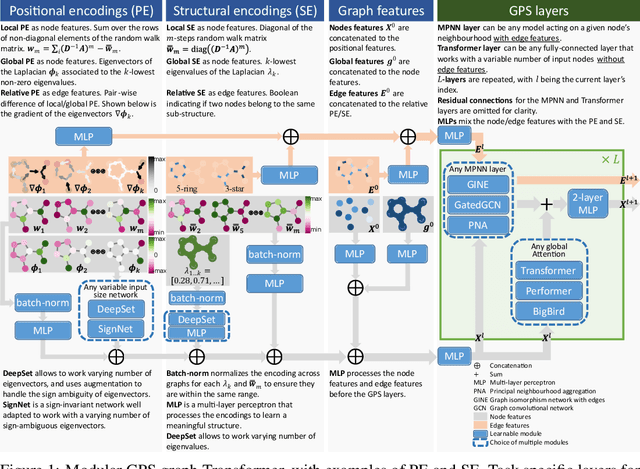
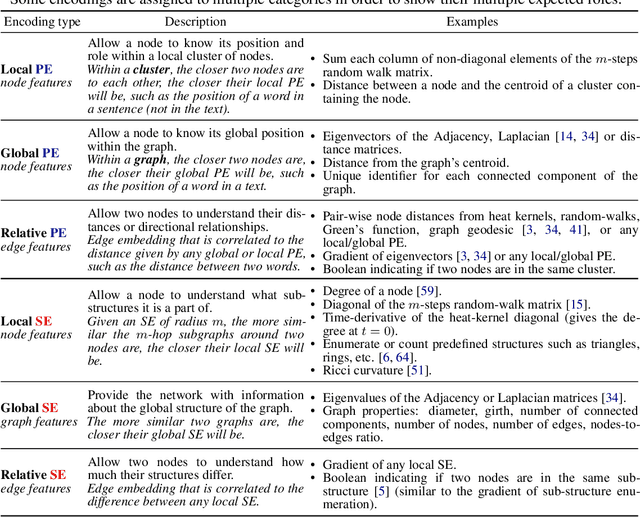
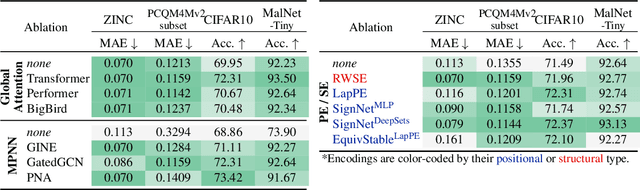
We propose a recipe on how to build a general, powerful, scalable (GPS) graph Transformer with linear complexity and state-of-the-art results on a diverse set of benchmarks. Graph Transformers (GTs) have gained popularity in the field of graph representation learning with a variety of recent publications but they lack a common foundation about what constitutes a good positional or structural encoding, and what differentiates them. In this paper, we summarize the different types of encodings with a clearer definition and categorize them as being $\textit{local}$, $\textit{global}$ or $\textit{relative}$. Further, GTs remain constrained to small graphs with few hundred nodes, and we propose the first architecture with a complexity linear to the number of nodes and edges $O(N+E)$ by decoupling the local real-edge aggregation from the fully-connected Transformer. We argue that this decoupling does not negatively affect the expressivity, with our architecture being a universal function approximator for graphs. Our GPS recipe consists of choosing 3 main ingredients: (i) positional/structural encoding, (ii) local message-passing mechanism, and (iii) global attention mechanism. We build and open-source a modular framework $\textit{GraphGPS}$ that supports multiple types of encodings and that provides efficiency and scalability both in small and large graphs. We test our architecture on 11 benchmarks and show very competitive results on all of them, show-casing the empirical benefits gained by the modularity and the combination of different strategies.
Time-inhomogeneous diffusion geometry and topology
Mar 28, 2022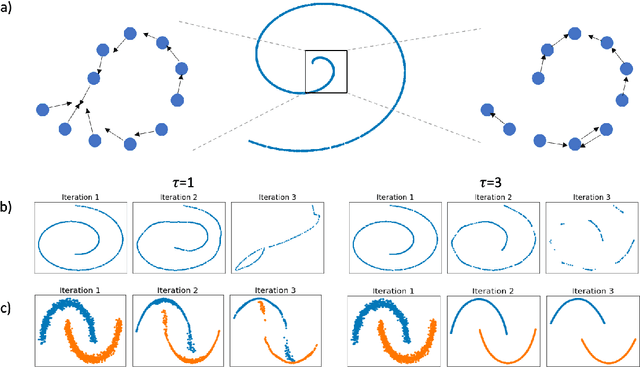
Diffusion condensation is a dynamic process that yields a sequence of multiscale data representations that aim to encode meaningful abstractions. It has proven effective for manifold learning, denoising, clustering, and visualization of high-dimensional data. Diffusion condensation is constructed as a time-inhomogeneous process where each step first computes and then applies a diffusion operator to the data. We theoretically analyze the convergence and evolution of this process from geometric, spectral, and topological perspectives. From a geometric perspective, we obtain convergence bounds based on the smallest transition probability and the radius of the data, whereas from a spectral perspective, our bounds are based on the eigenspectrum of the diffusion kernel. Our spectral results are of particular interest since most of the literature on data diffusion is focused on homogeneous processes. From a topological perspective, we show diffusion condensation generalizes centroid-based hierarchical clustering. We use this perspective to obtain a bound based on the number of data points, independent of their location. To understand the evolution of the data geometry beyond convergence, we use topological data analysis. We show that the condensation process itself defines an intrinsic diffusion homology. We use this intrinsic topology as well as an ambient topology to study how the data changes over diffusion time. We demonstrate both homologies in well-understood toy examples. Our work gives theoretical insights into the convergence of diffusion condensation, and shows that it provides a link between topological and geometric data analysis.
Overcoming Oversmoothness in Graph Convolutional Networks via Hybrid Scattering Networks
Jan 22, 2022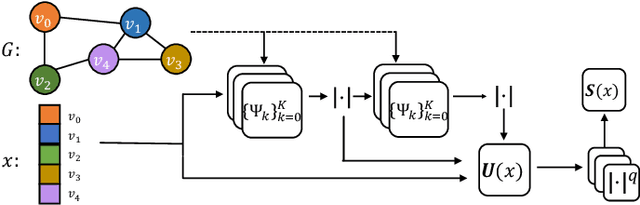
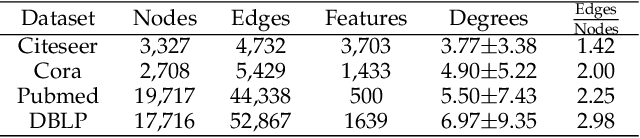
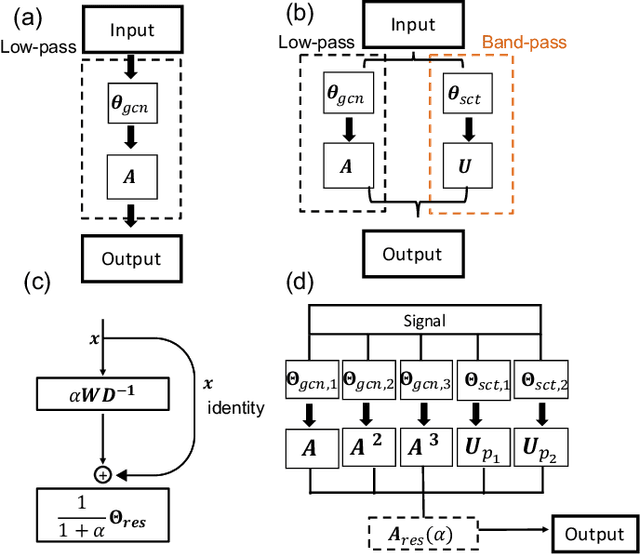
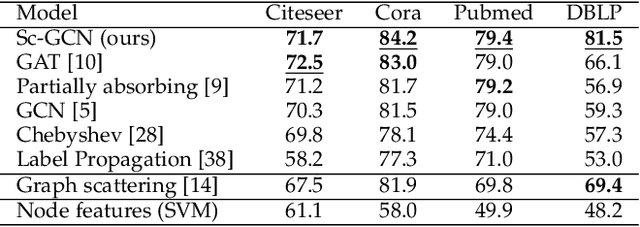
Geometric deep learning (GDL) has made great strides towards generalizing the design of structure-aware neural network architectures from traditional domains to non-Euclidean ones, such as graphs. This gave rise to graph neural network (GNN) models that can be applied to graph-structured datasets arising, for example, in social networks, biochemistry, and material science. Graph convolutional networks (GCNs) in particular, inspired by their Euclidean counterparts, have been successful in processing graph data by extracting structure-aware features. However, current GNN models (and GCNs in particular) are known to be constrained by various phenomena that limit their expressive power and ability to generalize to more complex graph datasets. Most models essentially rely on low-pass filtering of graph signals via local averaging operations, thus leading to oversmoothing. Here, we propose a hybrid GNN framework that combines traditional GCN filters with band-pass filters defined via the geometric scattering transform. We further introduce an attention framework that allows the model to locally attend over the combined information from different GNN filters at the node level. Our theoretical results establish the complementary benefits of the scattering filters to leverage structural information from the graph, while our experiments show the benefits of our method on various learning tasks.
Learning shared neural manifolds from multi-subject FMRI data
Dec 22, 2021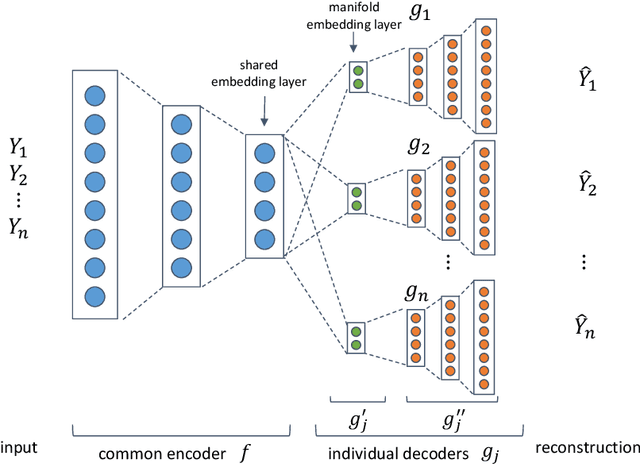
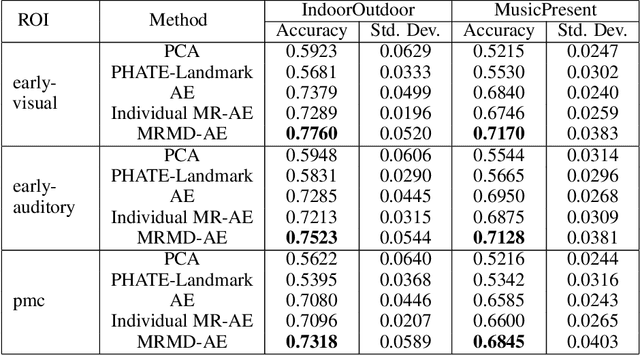
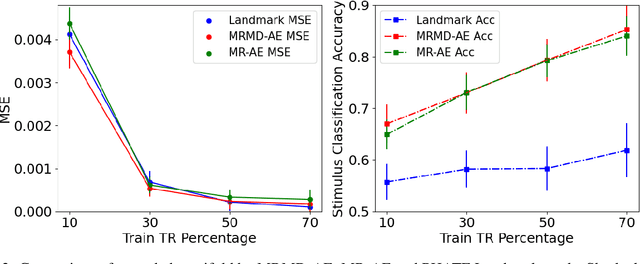
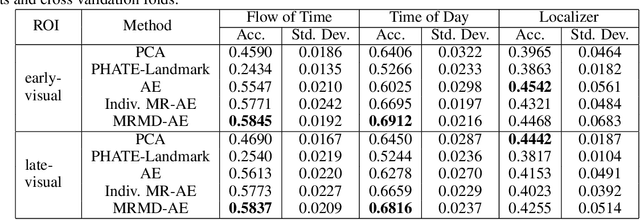
Functional magnetic resonance imaging (fMRI) is a notoriously noisy measurement of brain activity because of the large variations between individuals, signals marred by environmental differences during collection, and spatiotemporal averaging required by the measurement resolution. In addition, the data is extremely high dimensional, with the space of the activity typically having much lower intrinsic dimension. In order to understand the connection between stimuli of interest and brain activity, and analyze differences and commonalities between subjects, it becomes important to learn a meaningful embedding of the data that denoises, and reveals its intrinsic structure. Specifically, we assume that while noise varies significantly between individuals, true responses to stimuli will share common, low-dimensional features between subjects which are jointly discoverable. Similar approaches have been exploited previously but they have mainly used linear methods such as PCA and shared response modeling (SRM). In contrast, we propose a neural network called MRMD-AE (manifold-regularized multiple decoder, autoencoder), that learns a common embedding from multiple subjects in an experiment while retaining the ability to decode to individual raw fMRI signals. We show that our learned common space represents an extensible manifold (where new points not seen during training can be mapped), improves the classification accuracy of stimulus features of unseen timepoints, as well as improves cross-subject translation of fMRI signals. We believe this framework can be used for many downstream applications such as guided brain-computer interface (BCI) training in the future.
MURAL: An Unsupervised Random Forest-Based Embedding for Electronic Health Record Data
Nov 19, 2021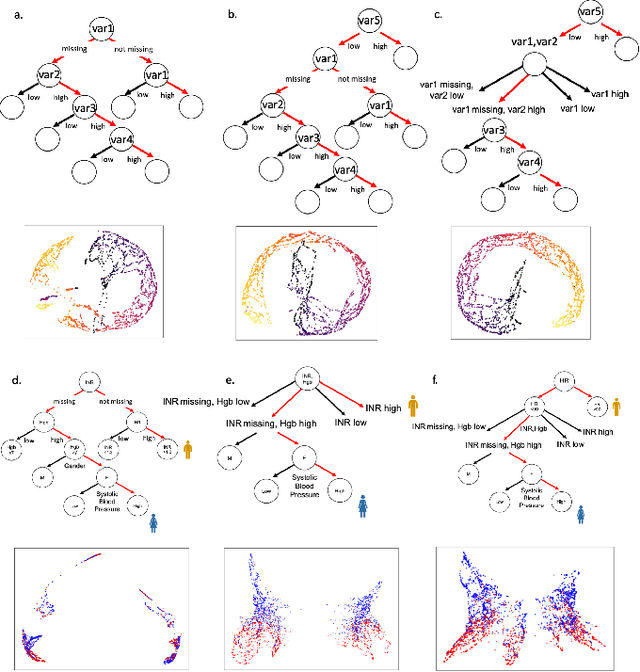
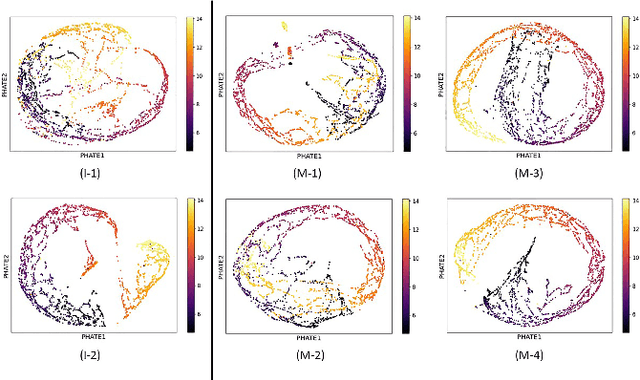
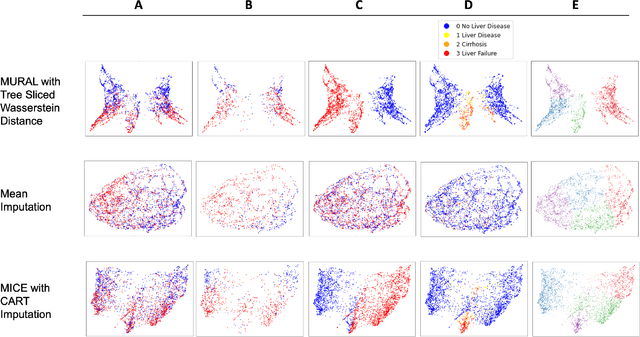
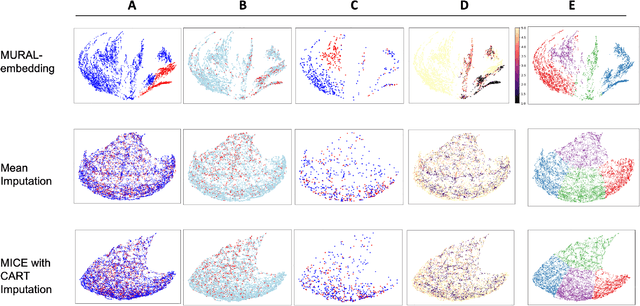
A major challenge in embedding or visualizing clinical patient data is the heterogeneity of variable types including continuous lab values, categorical diagnostic codes, as well as missing or incomplete data. In particular, in EHR data, some variables are {\em missing not at random (MNAR)} but deliberately not collected and thus are a source of information. For example, lab tests may be deemed necessary for some patients on the basis of suspected diagnosis, but not for others. Here we present the MURAL forest -- an unsupervised random forest for representing data with disparate variable types (e.g., categorical, continuous, MNAR). MURAL forests consist of a set of decision trees where node-splitting variables are chosen at random, such that the marginal entropy of all other variables is minimized by the split. This allows us to also split on MNAR variables and discrete variables in a way that is consistent with the continuous variables. The end goal is to learn the MURAL embedding of patients using average tree distances between those patients. These distances can be fed to nonlinear dimensionality reduction method like PHATE to derive visualizable embeddings. While such methods are ubiquitous in continuous-valued datasets (like single cell RNA-sequencing) they have not been used extensively in mixed variable data. We showcase the use of our method on one artificial and two clinical datasets. We show that using our approach, we can visualize and classify data more accurately than competing approaches. Finally, we show that MURAL can also be used to compare cohorts of patients via the recently proposed tree-sliced Wasserstein distances.