 Add to Chrome
 Add to Firefox
 Add to Edge
Inductive Graph Layout with Implicit Neural Fields
Aug 09, 2026
A graph layout is normally a table of $N$ free coordinates. We optimise a function with a fixed number of parameters instead. This gives a drawing a sample complexity and an extensible domain. Force-directed algorithms remain the standard tools for graph drawing. The most accurate among them minimise stress in the Kamada-Kawai formulation by directly optimising the node coordinates, at a full objective cost of $O(N^2)$ in time and space. Here, we propose Fling (Field Layout via Implicit Neural Geometry), a small neural network mapping the distances of each node to a set of landmarks, positioning it in the plane by training on the layout energy. The full spring system then becomes tractable without its distance matrix, as rest lengths follow from a landmark bound in constant time per pair while a second network learns the majorisation sums from exact anchor rows, at $O(|\mathcal{A}|N)$ per step for $|\mathcal{A}|\ll N$ anchors. Unlike neural drawers that read the graph by message passing, we represent the drawing as a function of node features. An unseen node costs one forward pass, where sparse and low-rank majorisation remain transductive. As the unknowns are weights rather than coordinates, the energy only requires a small fraction of the nodes, and a field fitted that way outperforms PivotMDS, landmark MDS, and a kernel ridge trained on the same energy and features, when the task is fitting the energy of a graph from a sample of its nodes. In addition, the same parameterisation enables a stochastic pivot stress variant, an aesthetics-optimised variant carrying a neighbour-embedding energy with node-edge clearance and crossing terms on the same field, and conditioning on the weight between two energies gives a whole layout family from one run.

FloDR: An invertible dimensionality reduction method based on a normalising flow
Jul 28, 2026It is common for two-dimensional embeddings of high-dimensional data to be read far beyond what they can support. Distances in and between clusters, the meaning behind empty spaces, and the amount of structure hidden at each point are generally invisible in the output of methods such as t-SNE and UMAP. This is because the information that could support the meaning of these properties is discarded during the optimisation process. Here, we present FloDR, a dimensionality reduction method that embeds data through an invertible normalising flow. While FloDR only uses the first two output coordinates to create a two-dimensional embedding, it retains the remaining coordinates rather than discarding them. In addition to the embedding, an exact inverse and an exact density are properties of a trained mapping, which enable diagnostic visualisations that are computed from the exact inverse of the model that drew the layout rather than from an approximate one. Specifically, we draw two fields, the conditional spread, which measures how much of the original data remains undetermined at each embedding position in input units, and the hidden contrast, which measures how much information about a labelled contrast the two plotted coordinates discard. Both fields are rendered with a prespecified test against a held out portion of the input data and a bootstrap confidence. A field that fails the test is reported as refused.
Graph Set Transformer
Jun 03, 2026We introduce the Graph Set Transformer (GST), a neural network architecture for learning on sets of graphs, designed for tasks in which per-element predictions depend on set-wide context as well as local structure. Existing architectures, including DeepSets and SetTransformer, require pre-encoded graph embeddings from a separate GNN, creating a bottleneck between feature extraction and set-level contextualisation. In contrast, GST interleaves node-level feature propagation and cross-graph contextual modelling at every layer, fusing the two levels of information through a gating mechanism. We evaluate GST on a controlled synthetic suite designed to isolate set-conditional structural reasoning and on three real-data benchmarks spanning per-atom reaction-centre identification, reaction yield prediction, and image classification. Under matched parameter budgets, GST performs better than the baselines across these settings. An architectural ablation strongly suggests that the interleaving of local and set context contributes substantially to this advantage.
Social and environmental impact of recent developments in machine learning on biology and chemistry research
Oct 01, 2022


Potential societal and environmental effects such as the rapidly increasing resource use and the associated environmental impact, reproducibility issues, and exclusivity, the privatization of ML research leading to a public research brain-drain, a narrowing of the research effort caused by a focus on deep learning, and the introduction of biases through a lack of sociodemographic diversity in data and personnel caused by recent developments in machine learning are a current topic of discussion and scientific publications. However, these discussions and publications focus mainly on computer science-adjacent fields, including computer vision and natural language processing or basic ML research. Using bibliometric analysis of the complete and full-text analysis of the open-access literature, we show that the same observations can be made for applied machine learning in chemistry and biology. These developments can potentially affect basic and applied research, such as drug discovery and development, beyond the known issue of biased data sets.
An automated machine learning-genetic algorithm (AutoML-GA) approach for efficient simulation-driven engine design optimization
Jan 07, 2021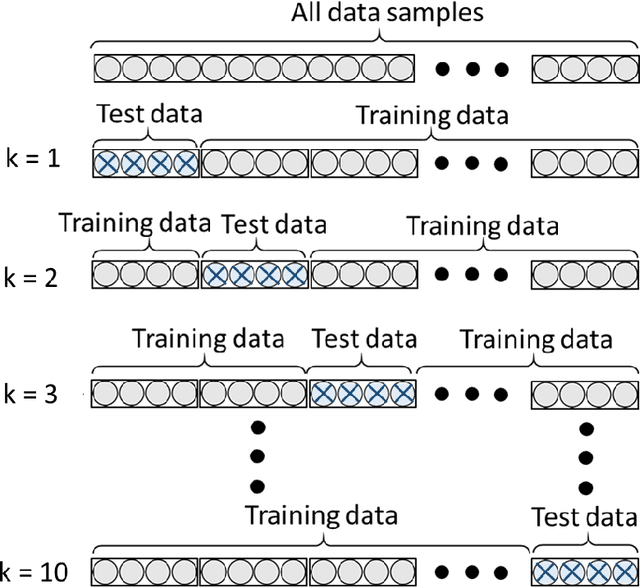
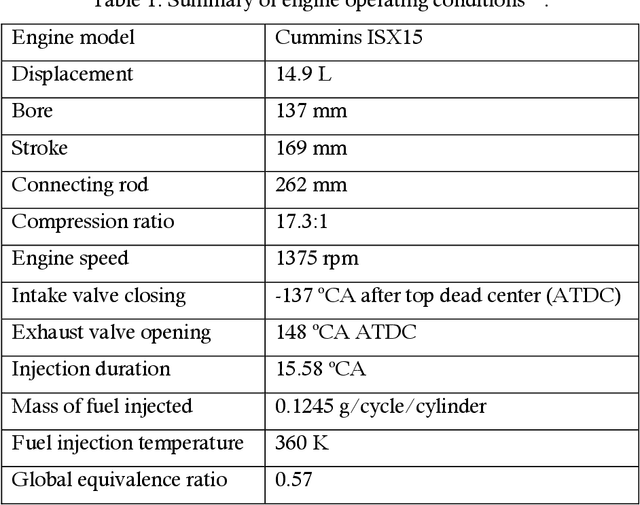
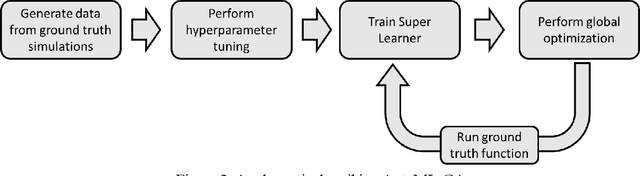
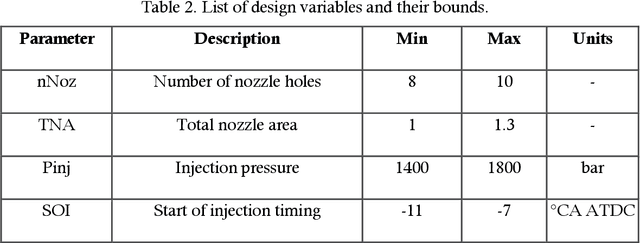
In recent years, the use of machine learning techniques as surrogate models for computational fluid dynamics (CFD) simulations has emerged as a promising method for reducing the computational cost associated with engine design optimization. However, such methods still suffer from drawbacks. One main disadvantage of such methods is that the default machine learning hyperparameters are often severely suboptimal for a given problem. This has often been addressed by manually trying out different hyperparameter settings, but this solution is ineffective in a high-dimensional hyperparameter space. Besides this problem, the amount of data needed for training is also not known a priori. In response to these issues which need to be addressed, this work describes and validates an automated active learning approach for surrogate-based optimization of internal combustion engines, AutoML-GA. In this approach, a Bayesian optimization technique is used to find the best machine learning hyperparameters based on an initial dataset obtained from a small number of CFD simulations. Subsequently, a genetic algorithm is employed to locate the design optimum on the surrogate surface trained with the optimal hyperparameters. In the vicinity of the design optimum, the solution is refined by repeatedly running CFD simulations at the projected optimum and adding the newly obtained data to the training dataset. It is shown that this approach leads to a better optimum with a lower number of CFD simulations, compared to the use of default hyperparameters. The developed approach offers the advantage of being a more hands-off approach that can be easily applied by researchers and engineers in industry who do not have a machine learning background.
Mapping the Space of Chemical Reactions Using Attention-Based Neural Networks
Dec 09, 2020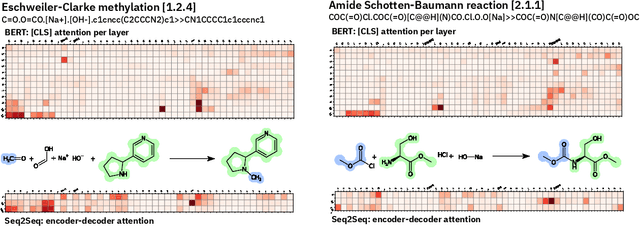
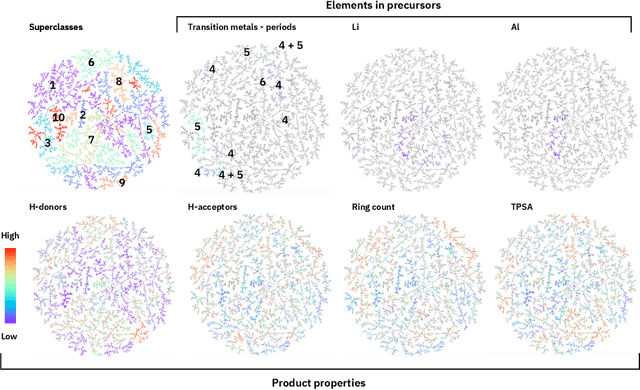
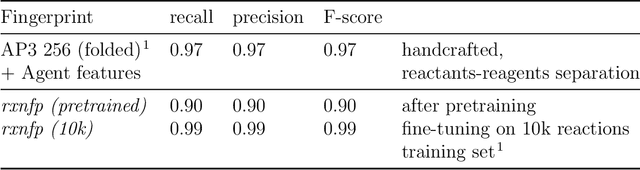

Organic reactions are usually assigned to classes containing reactions with similar reagents and mechanisms. Reaction classes facilitate the communication of complex concepts and efficient navigation through chemical reaction space. However, the classification process is a tedious task. It requires the identification of the corresponding reaction class template via annotation of the number of molecules in the reactions, the reaction center, and the distinction between reactants and reagents. This work shows that transformer-based models can infer reaction classes from non-annotated, simple text-based representations of chemical reactions. Our best model reaches a classification accuracy of 98.2%. We also show that the learned representations can be used as reaction fingerprints that capture fine-grained differences between reaction classes better than traditional reaction fingerprints. The insights into chemical reaction space enabled by our learned fingerprints are illustrated by an interactive reaction atlas providing visual clustering and similarity searching.
Visualization of Very Large High-Dimensional Data Sets as Minimum Spanning Trees
Aug 16, 2019


Here, we introduce a new data visualization and exploration method, TMAP (tree-map), which exploits locality sensitive hashing, Kruskal's minimum-spanning-tree algorithm, and a multilevel multipole-based graph layout algorithm to represent large and high dimensional data sets as a tree structure, which is readily understandable and explorable. Compared to other data visualization methods such as t-SNE or UMAP, TMAP increases the size of data sets that can be visualized due to its significantly lower memory requirements and running time and should find broad applicability in the age of big data. We exemplify TMAP in the area of cheminformatics with interactive maps for 1.16 million drug-like molecules from ChEMBL, 10.1 million small molecule fragments from FDB17, and 131 thousand 3D- structures of biomolecules from the PDB Databank, and to visualize data from literature (GUTENBERG data set), cancer biology (PANSCAN data set) and particle physics (MiniBooNE data set). TMAP is available as a Python package. Installation, usage instructions and application examples can be found at http://tmap.gdb.tools.