 Add to Chrome
 Add to Firefox
 Add to Edge
Analyzing Polysemy Evolution Using Semantic Cells
Aug 06, 2024

The senses of words evolve. The sense of the same word may change from today to tomorrow, and multiple senses of the same word may be the result of the evolution of each other, that is, they may be parents and children. If we view Juba as an evolving ecosystem, the paradigm of learning the correct answer, which does not move with the sense of a word, is no longer valid. This paper is a case study that shows that word polysemy is an evolutionary consequence of the modification of Semantic Cells, which has al-ready been presented by the author, by introducing a small amount of diversity in its initial state as an example of analyzing the current set of short sentences. In particular, the analysis of a sentence sequence of 1000 sentences in some order for each of the four senses of the word Spring, collected using Chat GPT, shows that the word acquires the most polysemy monotonically in the analysis when the senses are arranged in the order in which they have evolved. In other words, we present a method for analyzing the dynamism of a word's acquiring polysemy with evolution and, at the same time, a methodology for viewing polysemy from an evolutionary framework rather than a learning-based one.
Analyzing the Polysemy Evolution using Semantic Cells
Jul 23, 2024The senses of words evolve. The sense of the same word may change from today to tomorrow, and multiple senses of the same word may be the result of the evolution of each other, that is, they may be parents and children. If we view Juba as an evolving ecosystem, the paradigm of learning the correct answer, which does not move with the sense of a word, is no longer valid. This paper is a case study that shows that word polysemy is an evolutionary consequence of the modification of Semantic Cells, which has al-ready been presented by the author, by introducing a small amount of diversity in its initial state as an example of analyzing the current set of short sentences. In particular, the analysis of a sentence sequence of 1000 sentences in some order for each of the four senses of the word Spring, collected using Chat GPT, shows that the word acquires the most polysemy monotonically in the analysis when the senses are arranged in the order in which they have evolved. In other words, we present a method for analyzing the dynamism of a word's acquiring polysemy with evolution and, at the same time, a methodology for viewing polysemy from an evolutionary framework rather than a learning-based one.
Semantic Cells: Evolutional Process to Acquire Sense Diversity of Items
Apr 26, 2024Previous models for learning the semantic vectors of items and their groups, such as words, sentences, nodes, and graphs, using distributed representation have been based on the assumption that the basic sense of an item corresponds to one vector composed of dimensions corresponding to hidden contexts in the target real world, from which multiple senses of the item are obtained by conforming to lexical databases or adapting to the context. However, there may be multiple senses of an item, which are hardly assimilated and change or evolve dynamically following the contextual shift even within a document or a restricted period. This is a process similar to the evolution or adaptation of a living entity with/to environmental shifts. Setting the scope of disambiguation of items for sensemaking, the author presents a method in which a word or item in the data embraces multiple semantic vectors that evolve via interaction with others, similar to a cell embracing chromosomes crossing over with each other. We obtained two preliminary results: (1) the role of a word that evolves to acquire the largest or lower-middle variance of semantic vectors tends to be explainable by the author of the text; (2) the epicenters of earthquakes that acquire larger variance via crossover, corresponding to the interaction with diverse areas of land crust, are likely to correspond to the epicenters of forthcoming large earthquakes.
Collect and Connect Data Leaves to Feature Concepts: Interactive Graph Generation Toward Well-being
Dec 16, 2023Feature concepts and data leaves have been invented using datasets to foster creative thoughts for creating well-being in daily life. The idea, simply put, is to attach selected and collected data leaves that are summaries of event flows to be discovered from corresponding datasets, on the target feature concept representing the well-being aimed. A graph of existing or expected datasets to be attached to a feature concept is generated semi-automatically. Rather than sheer automated generative AI, our work addresses the process of generative artificial and natural intelligence to create the basis for data use and reuse.
Data Leaves: Scenario-oriented Metadata for Data Federative Innovation
Aug 07, 2022A method for representing the digest information of each dataset is proposed, oriented to the aid of innovative thoughts and the communication of data users who attempt to create valuable products, services, and business models using or combining datasets. Compared with methods for connecting datasets via shared attributes (i.e., variables), this method connects datasets via events, situations, or actions in a scenario that is supposed to be active in the real world. This method reflects the consideration of the fitness of each metadata to the feature concept, which is an abstract of the information or knowledge expected to be acquired from data; thus, the users of the data acquire practical knowledge that fits the requirements of real businesses and real life, as well as grounds for realistic application of AI technologies to data.
Feature Concepts for Data Federative Innovations
Nov 05, 2021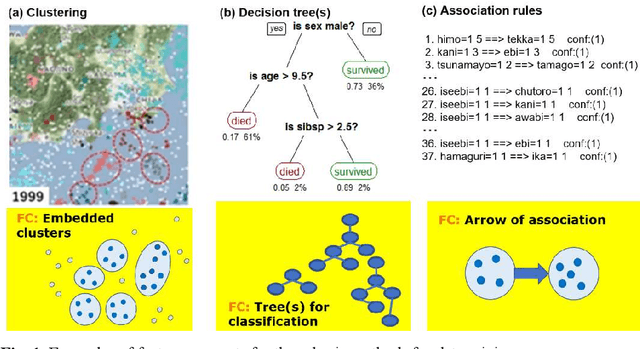
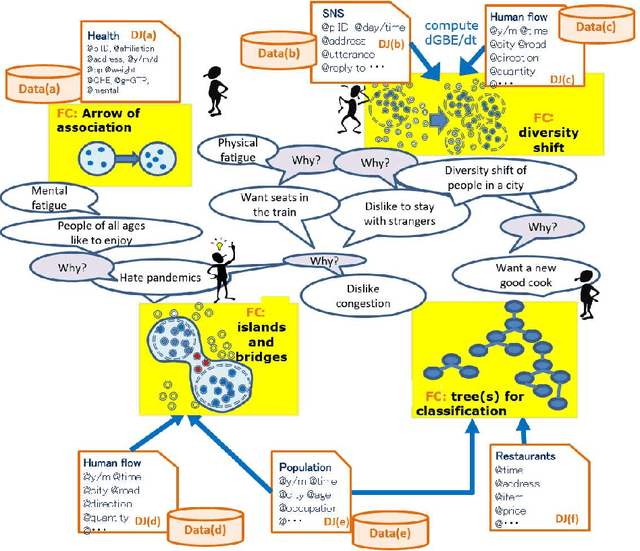
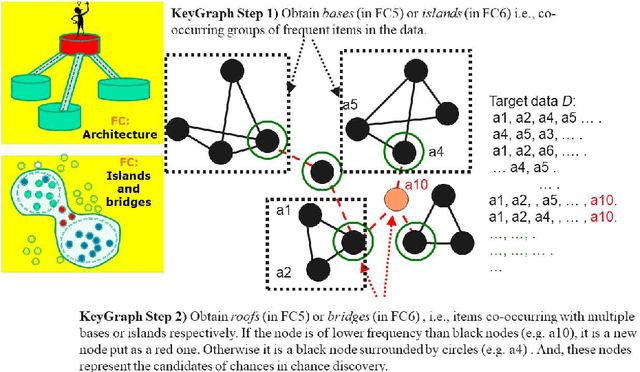
A feature concept, the essence of the data-federative innovation process, is presented as a model of the concept to be acquired from data. A feature concept may be a simple feature, such as a single variable, but is more likely to be a conceptual illustration of the abstract information to be obtained from the data. For example, trees and clusters are feature concepts for decision tree learning and clustering, respectively. Useful feature concepts for satis-fying the requirements of users of data have been elicited so far via creative communication among stakeholders in the market of data. In this short paper, such a creative communication is reviewed, showing a couple of appli-cations, for example, change explanation in markets and earthquakes, and highlight the feature concepts elicited in these cases.
Hierarchical entropy and domain interaction to understand the structure in an image
Apr 20, 2021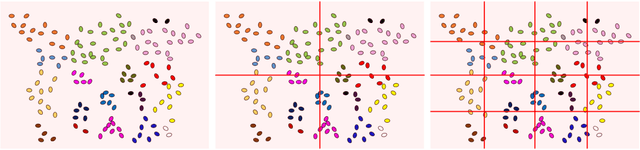
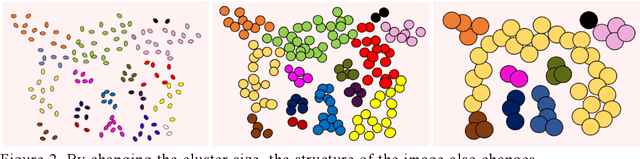
In this study, we devise a model that introduces two hierarchies into information entropy. The two hierarchies are the size of the region for which entropy is calculated and the size of the component that determines whether the structures in the image are integrated or not. And this model uses two indicators, hierarchical entropy and domain interaction. Both indicators increase or decrease due to the integration or fragmentation of the structure in the image. It aims to help people interpret and explain what the structure in an image looks like from two indicators that change with the size of the region and the component. First, we conduct experiments using images and qualitatively evaluate how the two indicators change. Next, we explain the relationship with the hidden structure of Vermeer's girl with a pearl earring using the change of hierarchical entropy. Finally, we clarify the relationship between the change of domain interaction and the appropriate segment result of the image by an experiment using a questionnaire.
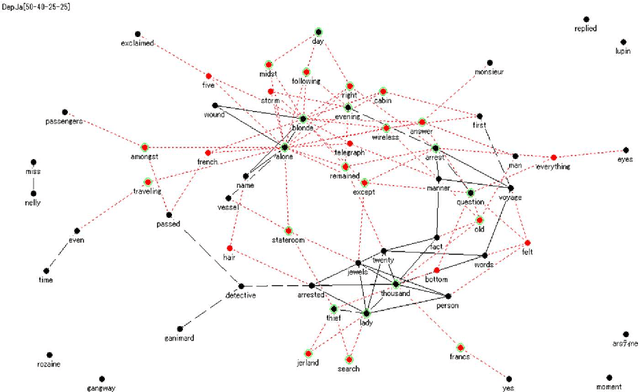
Extracting and Validating Explanatory Word Archipelagoes using Dual Entropy
Feb 22, 2020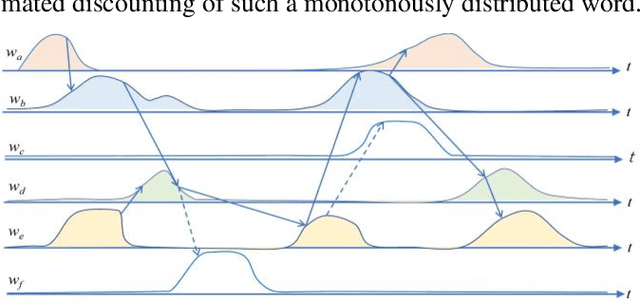
The logical connectivity of text is represented by the connectivity of words that form archipelagoes. Here, each archipelago is a sequence of islands of the occurrences of a certain word. An island here means the local sequence of sentences where the word is emphasized, and an archipelago of a length comparable to the target text is extracted using the co-variation of entropy A (the window-based entropy) on the distribution of the word's occurrences with the width of each time window. Then, the logical connectivity of text is evaluated on entropy B (the graph-based entropy) computed on the distribution of sentences to connected word-clusters obtained on the co-occurrence of words. The results show the parts of the target text with words forming archipelagoes extracted on entropy A, without learned or prepared knowledge, form an explanatory part of the text that is of smaller entropy B than the parts extracted by the baseline methods.
Reflective visualization and verbalization of unconscious preference
Feb 02, 2009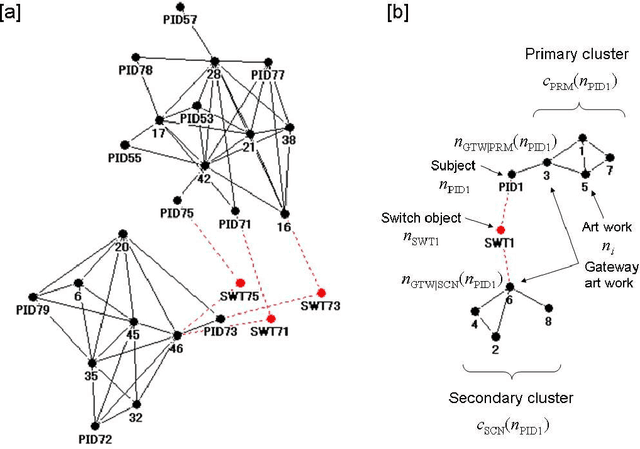
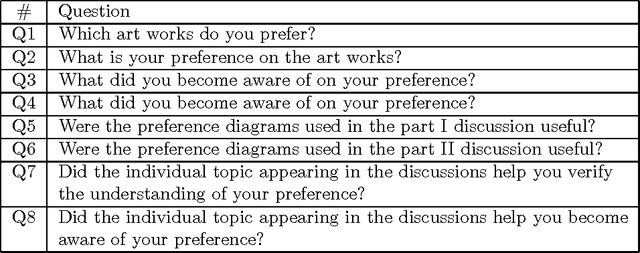
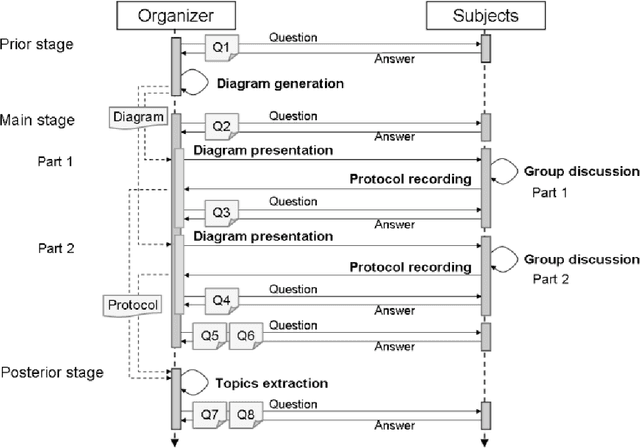
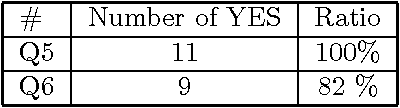
A new method is presented, that can help a person become aware of his or her unconscious preferences, and convey them to others in the form of verbal explanation. The method combines the concepts of reflection, visualization, and verbalization. The method was tested in an experiment where the unconscious preferences of the subjects for various artworks were investigated. In the experiment, two lessons were learned. The first is that it helps the subjects become aware of their unconscious preferences to verbalize weak preferences as compared with strong preferences through discussion over preference diagrams. The second is that it is effective to introduce an adjustable factor into visualization to adapt to the differences in the subjects and to foster their mutual understanding.
* This will be submitted to KES Journal
Intuitive visualization of the intelligence for the run-down of terrorist wire-pullers
May 28, 2008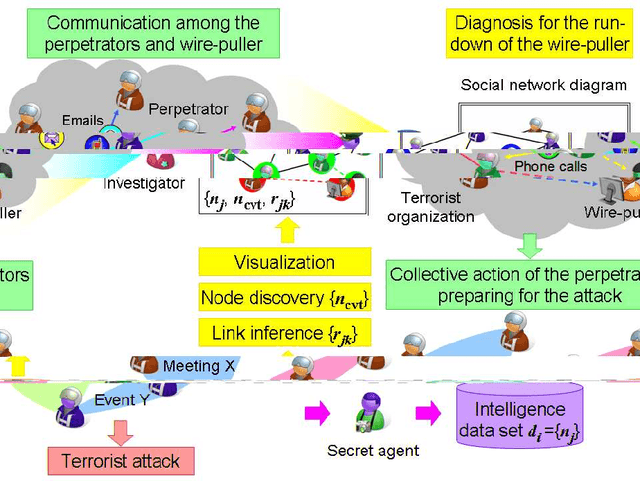
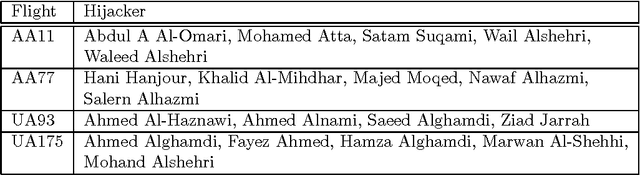

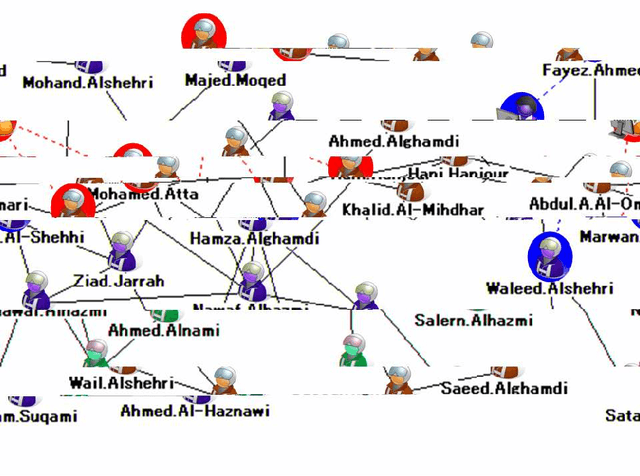
The investigation of the terrorist attack is a time-critical task. The investigators have a limited time window to diagnose the organizational background of the terrorists, to run down and arrest the wire-pullers, and to take an action to prevent or eradicate the terrorist attack. The intuitive interface to visualize the intelligence data set stimulates the investigators' experience and knowledge, and aids them in decision-making for an immediately effective action. This paper presents a computational method to analyze the intelligence data set on the collective actions of the perpetrators of the attack, and to visualize it into the form of a social network diagram which predicts the positions where the wire-pullers conceals themselves.