 Add to Chrome
 Add to Firefox
 Add to Edge
The Harsh Truth: Segment-Level Analysis of Harsh Driving Events in Milan Using Large-Scale Telematics, Street Networks, and Google Street View
May 29, 2026Police-reported crash statistics remain the standard input for urban road-safety assessment, but their incompleteness and reporting lag limit their usefulness for timely, fine-grained intervention design. Harsh acceleration and braking events are widely used as surrogate safety indicators, but have so far been studied only in comparatively small urban samples. This study analyses harsh events across the urban road network of Milan, combining high-resolution telematics from more than 4.2 million vehicles equipped with On-Board Units, segment-level traffic metrics from TomTom, street-network and infrastructure attributes from OpenStreetMap, and visual streetscape features extracted from Google Street View via semantic segmentation using a OneFormer model. We employ an analytical framework combining non-parametric Mann--Whitney U tests of segment-feature distributions between high- and low-harshness groups with supervised machine-learning regressors. We find that, once exposure is controlled for, wider carriageways, crossings and transit stops, and more open visual fields (higher sky- and road-pixel proportions) are associated with higher harsh-event intensity, while denser built frontage is associated with lower intensity. Finally, the cycling-infrastructure case study identifies a gradient in harsh-event intensity across facility types: markings-only cycle lanes are associated with a 19.5% higher harshness score, and mixed-traffic configurations with an 11.5% higher score, relative to physically separated cycle paths, conditional on the included controls. These results support context-specific rather than uniform urban-safety interventions and illustrate how large-scale telematics combined with open geospatial and visual data can inform Vision Zero decision-making at the metropolitan scale.
Driving Behavior Analysis through CAN Bus Data in an Uncontrolled Environment
Oct 09, 2017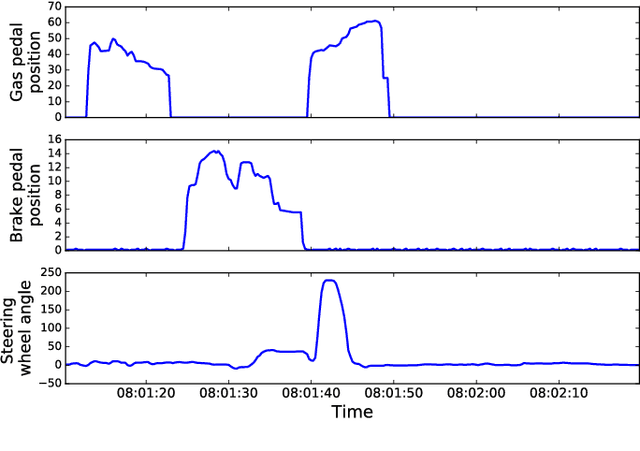
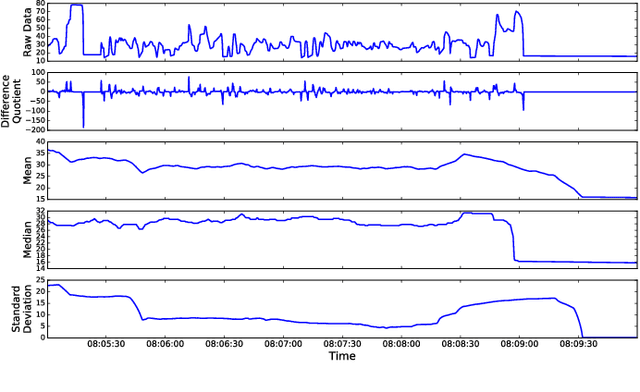
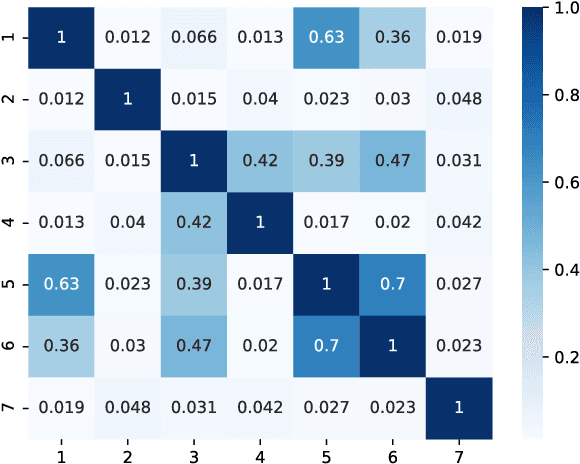
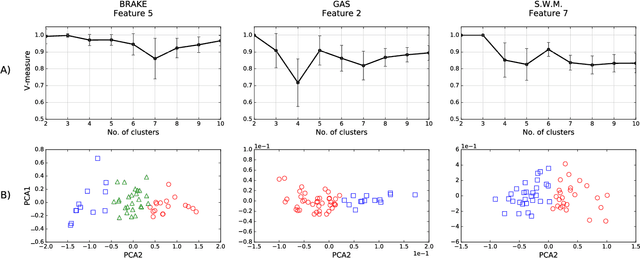
Cars can nowadays record several thousands of signals through the CAN bus technology and potentially provide real-time information on the car, the driver and the surrounding environment. This paper proposes a new method for the analysis and classification of driver behavior using a selected subset of CAN bus signals, specifically gas pedal position, brake pedal pressure, steering wheel angle, steering wheel momentum, velocity, RPM, frontal and lateral acceleration. Data has been collected in a completely uncontrolled experiment, where 64 people drove 10 cars for or a total of over 2000 driving trips without any type of pre-determined driving instruction on a wide variety of road scenarios. We propose an unsupervised learning technique that clusters drivers in different groups, and offers a validation method to test the robustness of clustering in a wide range of experimental settings. The minimal amount of data needed to preserve robust driver clustering is also computed. The presented study provides a new methodology for near-real-time classification of driver behavior in uncontrolled environments.