Timothy L. Kline
A Classification-Based Adaptive Segmentation Pipeline: Feasibility Study Using Polycystic Liver Disease and Metastases from Colorectal Cancer CT Images
May 02, 2024Abstract:Automated segmentation tools often encounter accuracy and adaptability issues when applied to images of different pathology. The purpose of this study is to explore the feasibility of building a workflow to efficiently route images to specifically trained segmentation models. By implementing a deep learning classifier to automatically classify the images and route them to appropriate segmentation models, we hope that our workflow can segment the images with different pathology accurately. The data we used in this study are 350 CT images from patients affected by polycystic liver disease and 350 CT images from patients presenting with liver metastases from colorectal cancer. All images had the liver manually segmented by trained imaging analysts. Our proposed adaptive segmentation workflow achieved a statistically significant improvement for the task of total liver segmentation compared to the generic single segmentation model (non-parametric Wilcoxon signed rank test, n=100, p-value << 0.001). This approach is applicable in a wide range of scenarios and should prove useful in clinical implementations of segmentation pipelines.
Developing a Machine Learning-Based Clinical Decision Support Tool for Uterine Tumor Imaging
Aug 20, 2023


Abstract:Uterine leiomyosarcoma (LMS) is a rare but aggressive malignancy. On imaging, it is difficult to differentiate LMS from, for example, degenerated leiomyoma (LM), a prevalent but benign condition. We curated a data set of 115 axial T2-weighted MRI images from 110 patients (mean [range] age=45 [17-81] years) with UTs that included five different tumor types. These data were randomly split stratifying on tumor volume into training (n=85) and test sets (n=30). An independent second reader (reader 2) provided manual segmentations for all test set images. To automate segmentation, we applied nnU-Net and explored the effect of training set size on performance by randomly generating subsets with 25, 45, 65 and 85 training set images. We evaluated the ability of radiomic features to distinguish between types of UT individually and when combined through feature selection and machine learning. Using the entire training set the mean [95% CI] fibroid DSC was measured as 0.87 [0.59-1.00] and the agreement between the two readers was 0.89 [0.77-1.0] on the test set. When classifying degenerated LM from LMS we achieve a test set F1-score of 0.80. Classifying UTs based on radiomic features we identify classifiers achieving F1-scores of 0.53 [0.45, 0.61] and 0.80 [0.80, 0.80] on the test set for the benign versus malignant, and degenerated LM versus LMS tasks. We show that it is possible to develop an automated method for 3D segmentation of the uterus and UT that is close to human-level performance with fewer than 150 annotated images. For distinguishing UT types, while we train models that merit further investigation with additional data, reliable automatic differentiation of UTs remains a challenge.
Role of Image Acquisition and Patient Phenotype Variations in Automatic Segmentation Model Generalization
Jul 26, 2023


Abstract:Purpose: This study evaluated the out-of-domain performance and generalization capabilities of automated medical image segmentation models, with a particular focus on adaptation to new image acquisitions and disease type. Materials: Datasets from both non-contrast and contrast-enhanced abdominal CT scans of healthy patients and those with polycystic kidney disease (PKD) were used. A total of 400 images (100 non-contrast controls, 100 contrast controls, 100 non-contrast PKD, 100 contrast PKD) were utilized for training/validation of models to segment kidneys, livers, and spleens, and the final models were then tested on 100 non-contrast CT images of patients affected by PKD. Performance was evaluated using Dice, Jaccard, TPR, and Precision. Results: Models trained on a diverse range of data showed no worse performance than models trained exclusively on in-domain data when tested on in-domain data. For instance, the Dice similarity of the model trained on 25% from each dataset was found to be non-inferior to the model trained purely on in-domain data. Conclusions: The results indicate that broader training examples significantly enhances model generalization and out-of-domain performance, thereby improving automated segmentation tools' applicability in clinical settings. The study's findings provide a roadmap for future research to adopt a data-centric approach in medical image AI model development.
AI in the Loop -- Functionalizing Fold Performance Disagreement to Monitor Automated Medical Image Segmentation Pipelines
May 15, 2023


Abstract:Methods for automatically flag poor performing-predictions are essential for safely implementing machine learning workflows into clinical practice and for identifying difficult cases during model training. We present a readily adoptable method using sub-models trained on different dataset folds, where their disagreement serves as a surrogate for model confidence. Thresholds informed by human interobserver values were used to determine whether a final ensemble model prediction would require manual review. In two different datasets (abdominal CT and MR predicting kidney tumors), our framework effectively identified low performing automated segmentations. Flagging images with a minimum Interfold test Dice score below human interobserver variability maximized the number of flagged images while ensuring maximum ensemble test Dice. When our internally trained model was applied to an external publicly available dataset (KiTS21), flagged images included smaller tumors than those observed in our internally trained dataset, demonstrating the methods robustness to flagging poor performing out-of-distribution input data. Comparing interfold sub-model disagreement against human interobserver values is an efficient way to approximate a model's epistemic uncertainty - its lack of knowledge due to insufficient relevant training data - a key functionality for adopting these applications in clinical practice.
Quantifying and Visualizing Vascular Branching Geometry with Micro-CT: Normalization of Intra- and Inter-Specimen Variations
Dec 20, 2022Abstract:Micro-CT images of the renal arteries of intact rat kidneys, which had their vasculature injected with the contrast agent polymer Microfil, were characterized. Measurement of inter-branch segment properties and the hierarchical structure of the vessel trees were computed by an automated algorithmic approach. The perfusion territories of the different kidneys, as well as the local diameters of the segmented vasculature were mapped onto the representative structures and visually explored. Various parameters were compared in order to outline key geometrical properties, properties which were shown to not have a wide range of inter-specimen variation. It is shown that the fractal scaling in non-symmetric branching reveals itself differently, than in symmetric branching (e.g., in the lung the mean bronchial diameters at each generation are closely related). Also, perfused tissue is shown to have very little inter-specimen variation and therefore could be used in future studies related to characterizing various disease states of tissues and organs based on vascular branching geometry.
Shape Aware Automatic Region-of-Interest Subdivisions
Dec 17, 2022Abstract:In a wide variety of fields, analysis of images involves defining a region and measuring its inherent properties. Such measurements include a region's surface area, curvature, volume, average gray and/or color scale, and so on. Furthermore, the subsequent subdivision of these regions is sometimes performed. These subdivisions are then used to measure local information, at even finer scales. However, simple griding or manual editing methods are typically used to subdivide a region into smaller units. The resulting subdivisions can therefore either not relate well to the actual shape or property of the region being studied (i.e., gridding methods), or be time consuming and based on user subjectivity (i.e., manual methods). The method discussed in this work extracts subdivisional units based on a region's general shape information. We present the results of applying our method to the medical image analysis of nested regions-of-interest of myocardial wall, where the subdivisions are used to study temporal and/or spatial heterogeneity of myocardial perfusion. This method is of particular interest for creating subdivision regions-of-interest (SROIs) when no variable intensity or other criteria within a region need be used to separate a particular region into subunits.
Reproducibility in medical image radiomic studies: contribution of dynamic histogram binning
Nov 09, 2022Abstract:The de facto standard of dynamic histogram binning for radiomic feature extraction leads to an elevated sensitivity to fluctuations in annotated regions. This may impact the majority of radiomic studies published recently and contribute to issues regarding poor reproducibility of radiomic-based machine learning that has led to significant efforts for data harmonization; however, we believe the issues highlighted here are comparatively neglected, but often remedied by choosing static binning. The field of radiomics has improved through the development of community standards and open-source libraries such as PyRadiomics. But differences in image acquisition, systematic differences between observers' annotations, and preprocessing steps still pose challenges. These can change the distribution of voxels altering extracted features and can be exacerbated with dynamic binning.
Best Practices and Scoring System on Reviewing A.I. based Medical Imaging Papers: Part 1 Classification
Feb 03, 2022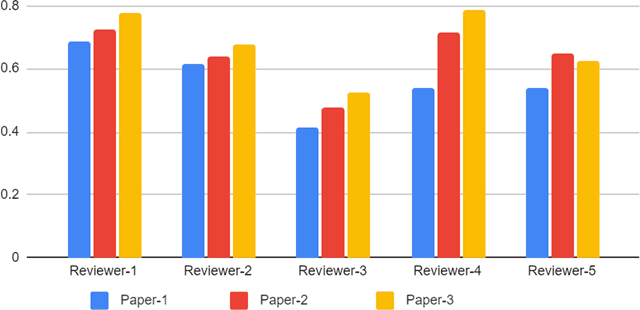
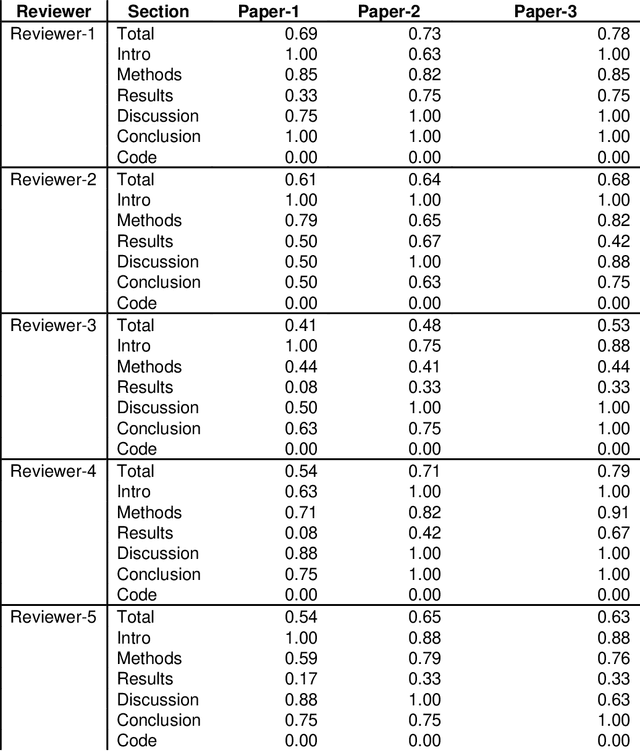
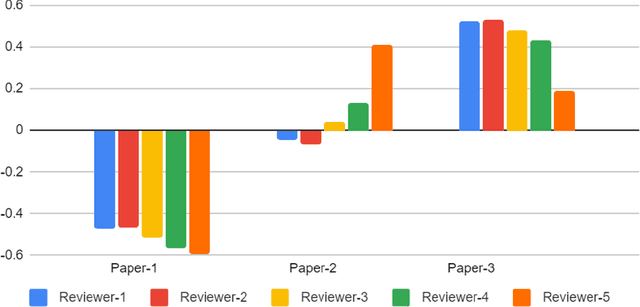
Abstract:With the recent advances in A.I. methodologies and their application to medical imaging, there has been an explosion of related research programs utilizing these techniques to produce state-of-the-art classification performance. Ultimately, these research programs culminate in submission of their work for consideration in peer reviewed journals. To date, the criteria for acceptance vs. rejection is often subjective; however, reproducible science requires reproducible review. The Machine Learning Education Sub-Committee of SIIM has identified a knowledge gap and a serious need to establish guidelines for reviewing these studies. Although there have been several recent papers with this goal, this present work is written from the machine learning practitioners standpoint. In this series, the committee will address the best practices to be followed in an A.I.-based study and present the required sections in terms of examples and discussion of what should be included to make the studies cohesive, reproducible, accurate, and self-contained. This first entry in the series focuses on the task of image classification. Elements such as dataset curation, data pre-processing steps, defining an appropriate reference standard, data partitioning, model architecture and training are discussed. The sections are presented as they would be detailed in a typical manuscript, with content describing the necessary information that should be included to make sure the study is of sufficient quality to be considered for publication. The goal of this series is to provide resources to not only help improve the review process for A.I.-based medical imaging papers, but to facilitate a standard for the information that is presented within all components of the research study. We hope to provide quantitative metrics in what otherwise may be a qualitative review process.
Predicting 1p19q Chromosomal Deletion of Low-Grade Gliomas from MR Images using Deep Learning
Nov 21, 2016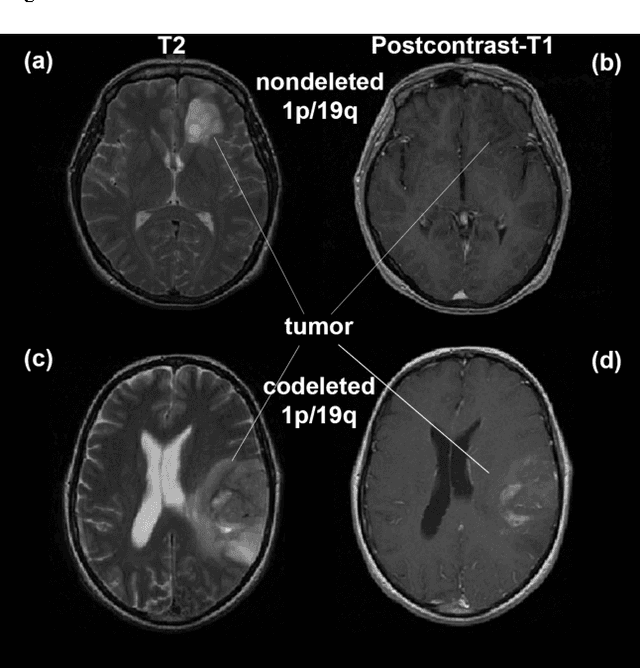
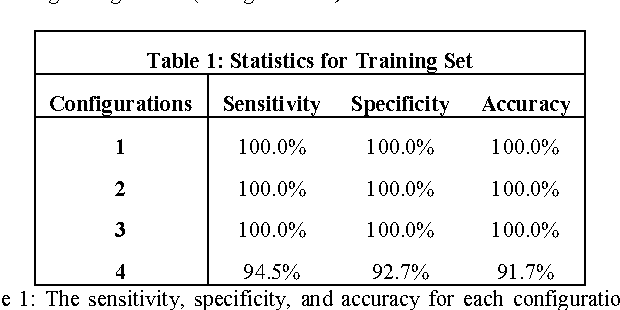
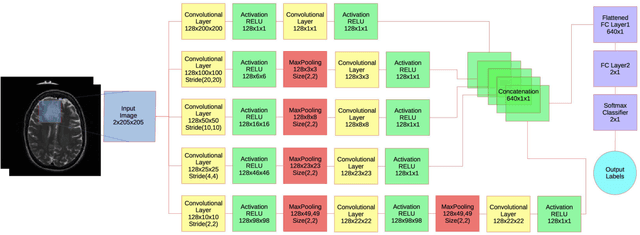
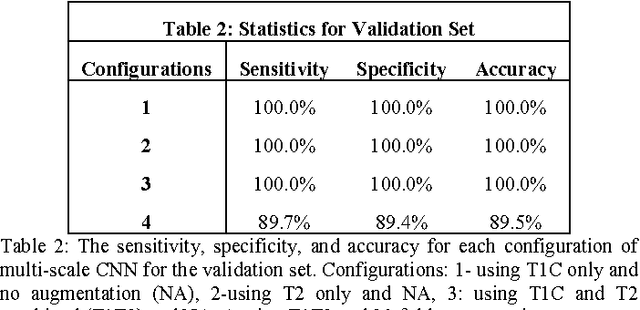
Abstract:Objective: Several studies have associated codeletion of chromosome arms 1p/19q in low-grade gliomas (LGG) with positive response to treatment and longer progression free survival. Therefore, predicting 1p/19q status is crucial for effective treatment planning of LGG. In this study, we predict the 1p/19q status from MR images using convolutional neural networks (CNN), which could be a noninvasive alternative to surgical biopsy and histopathological analysis. Method: Our method consists of three main steps: image registration, tumor segmentation, and classification of 1p/19q status using CNN. We included a total of 159 LGG with 3 image slices each who had biopsy-proven 1p/19q status (57 nondeleted and 102 codeleted) and preoperative postcontrast-T1 (T1C) and T2 images. We divided our data into training, validation, and test sets. The training data was balanced for equal class probability and then augmented with iterations of random translational shift, rotation, and horizontal and vertical flips to increase the size of the training set. We shuffled and augmented the training data to counter overfitting in each epoch. Finally, we evaluated several configurations of a multi-scale CNN architecture until training and validation accuracies became consistent. Results: The results of the best performing configuration on the unseen test set were 93.3% (sensitivity), 82.22% (specificity), and 87.7% (accuracy). Conclusion: Multi-scale CNN with their self-learning capability provides promising results for predicting 1p/19q status noninvasively based on T1C and T2 images. Significance: Predicting 1p/19q status noninvasively from MR images would allow selecting effective treatment strategies for LGG patients without the need for surgical biopsy.
 Add to Chrome
 Add to Firefox
 Add to Edge