 Add to Chrome
 Add to Firefox
 Add to Edge
Reliable uncertainty quantification for 2D/3D anatomical landmark localization using multi-output conformal prediction
Mar 18, 2025Automatic anatomical landmark localization in medical imaging requires not just accurate predictions but reliable uncertainty quantification for effective clinical decision support. Current uncertainty quantification approaches often fall short, particularly when combined with normality assumptions, systematically underestimating total predictive uncertainty. This paper introduces conformal prediction as a framework for reliable uncertainty quantification in anatomical landmark localization, addressing a critical gap in automatic landmark localization. We present two novel approaches guaranteeing finite-sample validity for multi-output prediction: Multi-output Regression-as-Classification Conformal Prediction (M-R2CCP) and its variant Multi-output Regression to Classification Conformal Prediction set to Region (M-R2C2R). Unlike conventional methods that produce axis-aligned hyperrectangular or ellipsoidal regions, our approaches generate flexible, non-convex prediction regions that better capture the underlying uncertainty structure of landmark predictions. Through extensive empirical evaluation across multiple 2D and 3D datasets, we demonstrate that our methods consistently outperform existing multi-output conformal prediction approaches in both validity and efficiency. This work represents a significant advancement in reliable uncertainty estimation for anatomical landmark localization, providing clinicians with trustworthy confidence measures for their diagnoses. While developed for medical imaging, these methods show promise for broader applications in multi-output regression problems.
From Haystack to Needle: Label Space Reduction for Zero-shot Classification
Feb 12, 2025We present Label Space Reduction (LSR), a novel method for improving zero-shot classification performance of Large Language Models (LLMs). LSR iteratively refines the classification label space by systematically ranking and reducing candidate classes, enabling the model to concentrate on the most relevant options. By leveraging unlabeled data with the statistical learning capabilities of data-driven models, LSR dynamically optimizes the label space representation at test time. Our experiments across seven benchmarks demonstrate that LSR improves macro-F1 scores by an average of 7.0% (up to 14.2%) with Llama-3.1-70B and 3.3% (up to 11.1%) with Claude-3.5-Sonnet compared to standard zero-shot classification baselines. To reduce the computational overhead of LSR, which requires an additional LLM call at each iteration, we propose distilling the model into a probabilistic classifier, allowing for efficient inference.
landmarker: a Toolkit for Anatomical Landmark Localization in 2D/3D Images
Jan 17, 2025


Anatomical landmark localization in 2D/3D images is a critical task in medical imaging. Although many general-purpose tools exist for landmark localization in classical computer vision tasks, such as pose estimation, they lack the specialized features and modularity necessary for anatomical landmark localization applications in the medical domain. Therefore, we introduce landmarker, a Python package built on PyTorch. The package provides a comprehensive, flexible toolkit for developing and evaluating landmark localization algorithms, supporting a range of methodologies, including static and adaptive heatmap regression. landmarker enhances the accuracy of landmark identification, streamlines research and development processes, and supports various image formats and preprocessing pipelines. Its modular design allows users to customize and extend the toolkit for specific datasets and applications, accelerating innovation in medical imaging. landmarker addresses a critical need for precision and customization in landmark localization tasks not adequately met by existing general-purpose pose estimation tools.
Conformal Prediction for Dose-Response Models with Continuous Treatments
Sep 30, 2024Understanding the dose-response relation between a continuous treatment and the outcome for an individual can greatly drive decision-making, particularly in areas like personalized drug dosing and personalized healthcare interventions. Point estimates are often insufficient in these high-risk environments, highlighting the need for uncertainty quantification to support informed decisions. Conformal prediction, a distribution-free and model-agnostic method for uncertainty quantification, has seen limited application in continuous treatments or dose-response models. To address this gap, we propose a novel methodology that frames the causal dose-response problem as a covariate shift, leveraging weighted conformal prediction. By incorporating propensity estimation, conformal predictive systems, and likelihood ratios, we present a practical solution for generating prediction intervals for dose-response models. Additionally, our method approximates local coverage for every treatment value by applying kernel functions as weights in weighted conformal prediction. Finally, we use a new synthetic benchmark dataset to demonstrate the significance of covariate shift assumptions in achieving robust prediction intervals for dose-response models.
Left-Right Swapping and Upper-Lower Limb Pairing for Robust Multi-Wearable Workout Activity Detection
Jul 22, 2024


This work presents the solution of the Signal Sleuths team for the 2024 HASCA WEAR challenge. The challenge focuses on detecting 18 workout activities (and the null class) using accelerometer data from 4 wearables - one worn on each limb. Data analysis revealed inconsistencies in wearable orientation within and across participants, leading to exploring novel multi-wearable data augmentation techniques. We investigate three models using a fixed feature set: (i) "raw": using all data as is, (ii) "left-right swapping": augmenting data by swapping left and right limb pairs, and (iii) "upper-lower limb paring": stacking data by using upper-lower limb pair combinations (2 wearables). Our experiments utilize traditional machine learning with multi-window feature extraction and temporal smoothing. Using 3-fold cross-validation, the raw model achieves a macro F1-score of 90.01%, whereas left-right swapping and upper-lower limb paring improve the scores to 91.30% and 91.87% respectively.
Conformal Predictive Systems Under Covariate Shift
Apr 23, 2024Conformal Predictive Systems (CPS) offer a versatile framework for constructing predictive distributions, allowing for calibrated inference and informative decision-making. However, their applicability has been limited to scenarios adhering to the Independent and Identically Distributed (IID) model assumption. This paper extends CPS to accommodate scenarios characterized by covariate shifts. We therefore propose Weighted CPS (WCPS), akin to Weighted Conformal Prediction (WCP), leveraging likelihood ratios between training and testing covariate distributions. This extension enables the construction of nonparametric predictive distributions capable of handling covariate shifts. We present theoretical underpinnings and conjectures regarding the validity and efficacy of WCPS and demonstrate its utility through empirical evaluations on both synthetic and real-world datasets. Our simulation experiments indicate that WCPS are probabilistically calibrated under covariate shift.
Conformal Monte Carlo Meta-learners for Predictive Inference of Individual Treatment Effects
Feb 07, 2024


Knowledge of the effect of interventions, called the treatment effect, is paramount for decision-making. Approaches to estimating this treatment effect, e.g. by using Conditional Average Treatment Effect (CATE) estimators, often only provide a point estimate of this treatment effect, while additional uncertainty quantification is frequently desired instead. Therefore, we present a novel method, the Conformal Monte Carlo (CMC) meta-learners, leveraging conformal predictive systems, Monte Carlo sampling, and CATE meta-learners, to instead produce a predictive distribution usable in individualized decision-making. Furthermore, we show how specific assumptions on the noise distribution of the outcome heavily affect these uncertainty predictions. Nonetheless, the CMC framework shows strong experimental coverage while retaining small interval widths to provide estimates of the true individual treatment effect.
tsdownsample: high-performance time series downsampling for scalable visualization
Jul 05, 2023


Interactive line chart visualizations greatly enhance the effective exploration of large time series. Although downsampling has emerged as a well-established approach to enable efficient interactive visualization of large datasets, it is not an inherent feature in most visualization tools. Furthermore, there is no library offering a convenient interface for high-performance implementations of prominent downsampling algorithms. To address these shortcomings, we present tsdownsample, an open-source Python package specifically designed for CPU-based, in-memory time series downsampling. Our library focuses on performance and convenient integration, offering optimized implementations of leading downsampling algorithms. We achieve this optimization by leveraging low-level SIMD instructions and multithreading capabilities in Rust. In particular, SIMD instructions were employed to optimize the argmin and argmax operations. This SIMD optimization, along with some algorithmic tricks, proved crucial in enhancing the performance of various downsampling algorithms. We evaluate the performance of tsdownsample and demonstrate its interoperability with an established visualization framework. Our performance benchmarks indicate that the algorithmic runtime of tsdownsample approximates the CPU's memory bandwidth. This work marks a significant advancement in bringing high-performance time series downsampling to the Python ecosystem, enabling scalable visualization. The open-source code can be found at https://github.com/predict-idlab/tsdownsample
Perfectly predicting ICU length of stay: too good to be true
Nov 10, 2022


A paper of Alsinglawi et al was recently accepted and published in Scientific Reports. In this paper, the authors aim to predict length of stay (LOS), discretized into either long (> 7 days) or short stays (< 7 days), of lung cancer patients in an ICU department using various machine learning techniques. The authors claim to achieve perfect results with an Area Under the Receiver Operating Characteristic curve (AUROC) of 100% with a Random Forest (RF) classifier with ADASYN class balancing over sampling technique, which if accurate could have significant implications for hospital management. However, we have identified several methodological flaws within the manuscript which cause the results to be overly optimistic and would have serious consequences if used in a clinical practice. Moreover, the reporting of the methodology is unclear and many important details are missing from the manuscript, which makes reproduction extremely difficult. We highlight the effect these oversights have had on the result and provide a more believable result of 88.91% AUROC when these oversights are corrected.
Do Not Sleep on Linear Models: Simple and Interpretable Techniques Outperform Deep Learning for Sleep Scoring
Jul 19, 2022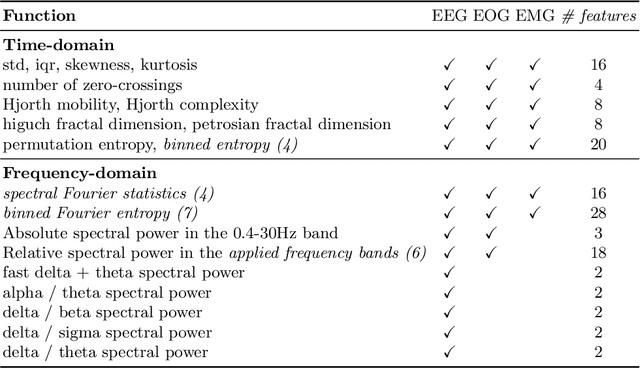
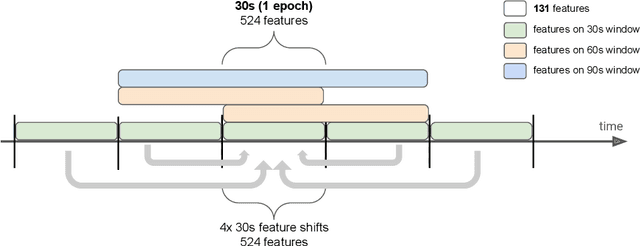
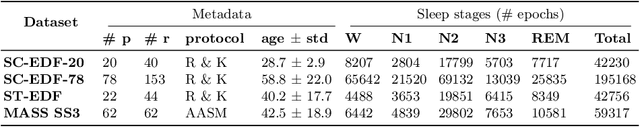
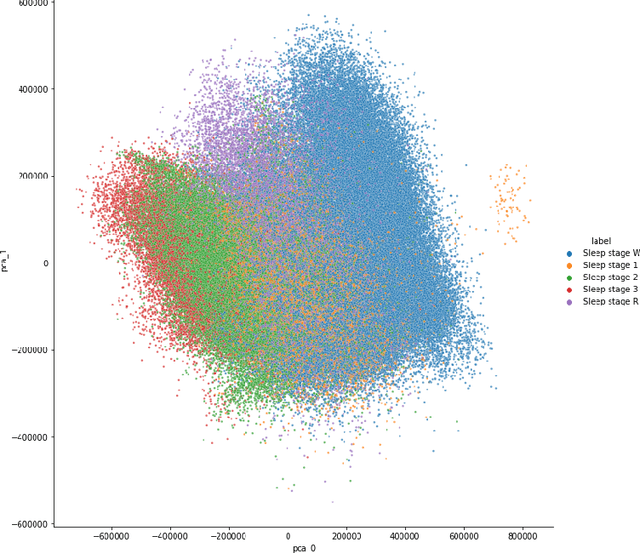
Over the last few years, research in automatic sleep scoring has mainly focused on developing increasingly complex deep learning architectures. However, recently these approaches achieved only marginal improvements, often at the expense of requiring more data and more expensive training procedures. Despite all these efforts and their satisfactory performance, automatic sleep staging solutions are not widely adopted in a clinical context yet. We argue that most deep learning solutions for sleep scoring are limited in their real-world applicability as they are hard to train, deploy, and reproduce. Moreover, these solutions lack interpretability and transparency, which are often key to increase adoption rates. In this work, we revisit the problem of sleep stage classification using classical machine learning. Results show that state-of-the-art performance can be achieved with a conventional machine learning pipeline consisting of preprocessing, feature extraction, and a simple machine learning model. In particular, we analyze the performance of a linear model and a non-linear (gradient boosting) model. Our approach surpasses state-of-the-art (that uses the same data) on two public datasets: Sleep-EDF SC-20 (MF1 0.810) and Sleep-EDF ST (MF1 0.795), while achieving competitive results on Sleep-EDF SC-78 (MF1 0.775) and MASS SS3 (MF1 0.817). We show that, for the sleep stage scoring task, the expressiveness of an engineered feature vector is on par with the internally learned representations of deep learning models. This observation opens the door to clinical adoption, as a representative feature vector allows to leverage both the interpretability and successful track record of traditional machine learning models.