 Add to Chrome
 Add to Firefox
 Add to Edge
Streamlining Video Analysis for Efficient Violence Detection
Nov 29, 2024This paper addresses the challenge of automated violence detection in video frames captured by surveillance cameras, specifically focusing on classifying scenes as "fight" or "non-fight." This task is critical for enhancing unmanned security systems, online content filtering, and related applications. We propose an approach using a 3D Convolutional Neural Network (3D CNN)-based model named X3D to tackle this problem. Our approach incorporates pre-processing steps such as tube extraction, volume cropping, and frame aggregation, combined with clustering techniques, to accurately localize and classify fight scenes. Extensive experimentation demonstrates the effectiveness of our method in distinguishing violent from non-violent events, providing valuable insights for advancing practical violence detection systems.
Multi-objective Binary Differential Approach with Parameter Tuning for Discovering Business Process Models: MoD-ProM
Jun 25, 2024Process discovery approaches analyze the business data to automatically uncover structured information, known as a process model. The quality of a process model is measured using quality dimensions -- completeness (replay fitness), preciseness, simplicity, and generalization. Traditional process discovery algorithms usually output a single process model. A single model may not accurately capture the observed behavior and overfit the training data. We have formed the process discovery problem in a multi-objective framework that yields several candidate solutions for the end user who can pick a suitable model based on the local environmental constraints (possibly varying). We consider the Binary Differential Evolution approach in a multi-objective framework for the task of process discovery. The proposed method employs dichotomous crossover/mutation operators. The parameters are tuned using Grey relational analysis combined with the Taguchi approach. {We have compared the proposed approach with the well-known single-objective algorithms and state-of-the-art multi-objective evolutionary algorithm -- Non-dominated Sorting Genetic Algorithm (NSGA-II).} Additional comparison via computing a weighted average of the quality dimensions is also undertaken. Results show that the proposed algorithm is computationally efficient and produces diversified candidate solutions that score high on the fitness functions. It is shown that the process models generated by the proposed approach are superior to or at least as good as those generated by the state-of-the-art algorithms.
Learning optimally separated class-specific subspace representations using convolutional autoencoder
May 19, 2021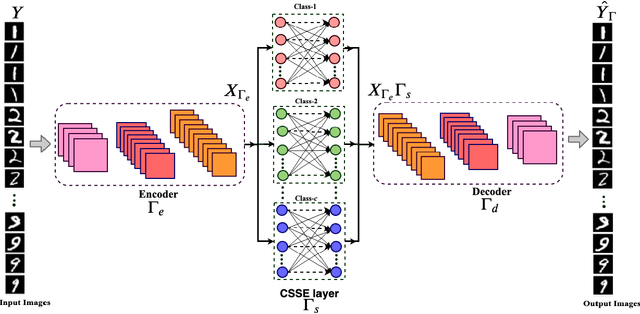
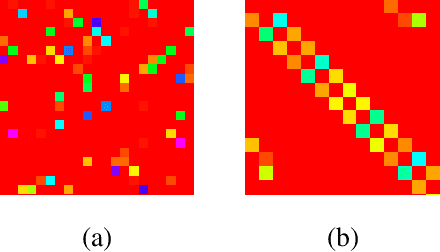
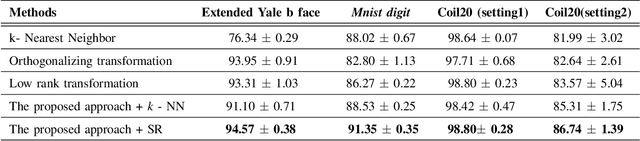
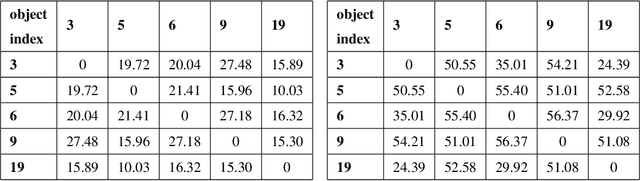
In this work, we propose a novel convolutional autoencoder based architecture to generate subspace specific feature representations that are best suited for classification task. The class-specific data is assumed to lie in low dimensional linear subspaces, which could be noisy and not well separated, i.e., subspace distance (principal angle) between two classes is very low. The proposed network uses a novel class-specific self expressiveness (CSSE) layer sandwiched between encoder and decoder networks to generate class-wise subspace representations which are well separated. The CSSE layer along with encoder/ decoder are trained in such a way that data still lies in subspaces in the feature space with minimum principal angle much higher than that of the input space. To demonstrate the effectiveness of the proposed approach, several experiments have been carried out on state-of-the-art machine learning datasets and a significant improvement in classification performance is observed over existing subspace based transformation learning methods.
ChartNet: Visual Reasoning over Statistical Charts using MAC-Networks
Nov 21, 2019


Despite the improvements in perception accuracies brought about via deep learning, developing systems combining accurate visual perception with the ability to reason over the visual percepts remains extremely challenging. A particular application area of interest from an accessibility perspective is that of reasoning over statistical charts such as bar and pie charts. To this end, we formulate the problem of reasoning over statistical charts as a classification task using MAC-Networks to give answers from a predefined vocabulary of generic answers. Additionally, we enhance the capabilities of MAC-Networks to give chart-specific answers to open-ended questions by replacing the classification layer by a regression layer to localize the textual answers present over the images. We call our network ChartNet, and demonstrate its efficacy on predicting both in vocabulary and out of vocabulary answers. To test our methods, we generated our own dataset of statistical chart images and corresponding question answer pairs. Results show that ChartNet consistently outperform other state-of-the-art methods on reasoning over these questions and may be a viable candidate for applications containing images of statistical charts.