 Add to Chrome
 Add to Firefox
 Add to Edge
Poro 34B and the Blessing of Multilinguality
Apr 02, 2024


The pretraining of state-of-the-art large language models now requires trillions of words of text, which is orders of magnitude more than available for the vast majority of languages. While including text in more than one language is an obvious way to acquire more pretraining data, multilinguality is often seen as a curse, and most model training efforts continue to focus near-exclusively on individual large languages. We believe that multilinguality can be a blessing and that it should be possible to substantially improve over the capabilities of monolingual models for small languages through multilingual training. In this study, we introduce Poro 34B, a 34 billion parameter model trained for 1 trillion tokens of Finnish, English, and programming languages, and demonstrate that a multilingual training approach can produce a model that not only substantially advances over the capabilities of existing models for Finnish, but also excels in translation and is competitive in its class in generating English and programming languages. We release the model parameters, scripts, and data under open licenses at https://huggingface.co/LumiOpen/Poro-34B.
Deep learning bank distress from news and numerical financial data
Sep 05, 2018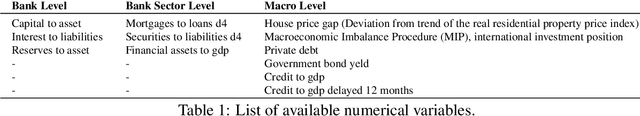
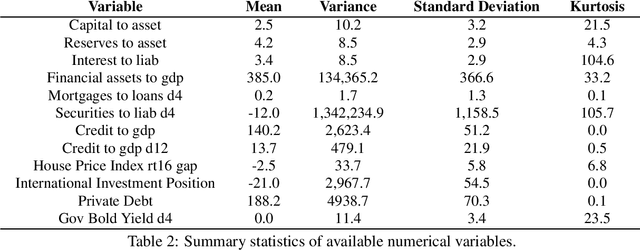
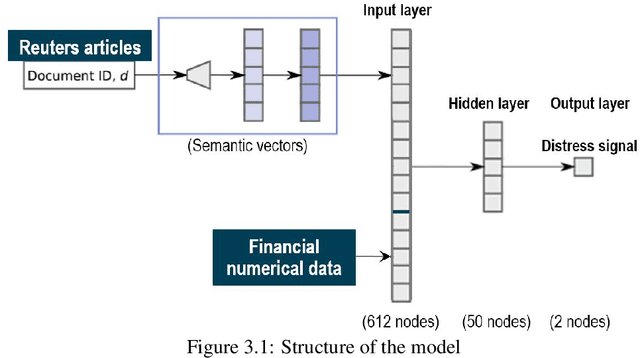
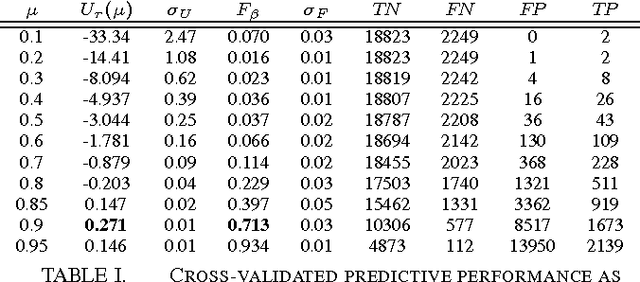
In this paper we focus our attention on the exploitation of the information contained in financial news to enhance the performance of a classifier of bank distress. Such information should be analyzed and inserted into the predictive model in the most efficient way and this task deals with all the issues related to text analysis and specifically analysis of news media. Among the different models proposed for such purpose, we investigate one of the possible deep learning approaches, based on a doc2vec representation of the textual data, a kind of neural network able to map the sequential and symbolic text input onto a reduced latent semantic space. Afterwards, a second supervised neural network is trained combining news data with standard financial figures to classify banks whether in distressed or tranquil states, based on a small set of known distress events. Then the final aim is not only the improvement of the predictive performance of the classifier but also to assess the importance of news data in the classification process. Does news data really bring more useful information not contained in standard financial variables? Our results seem to confirm such hypothesis.
Bank distress in the news: Describing events through deep learning
Dec 27, 2016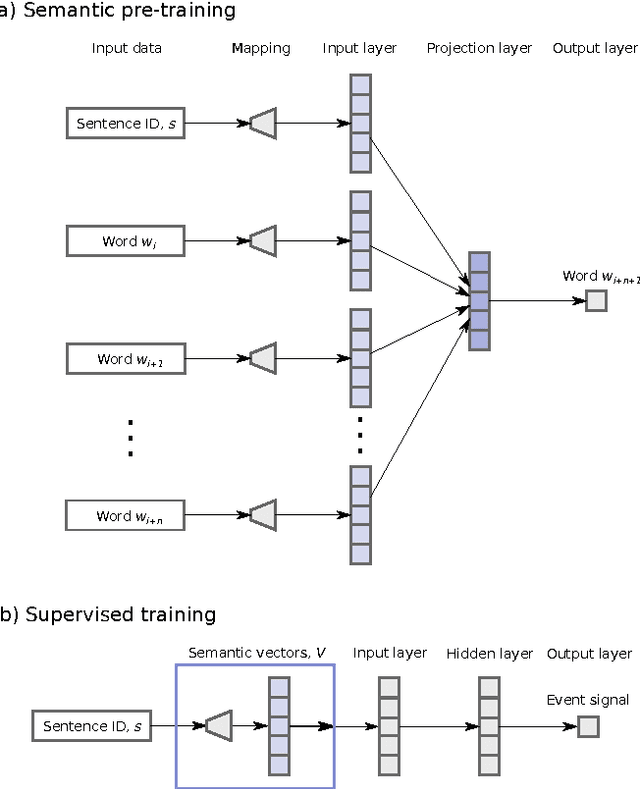
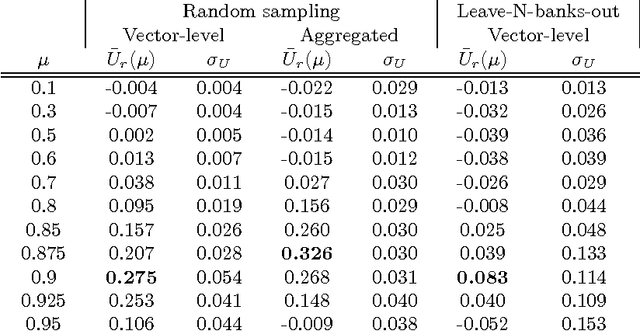
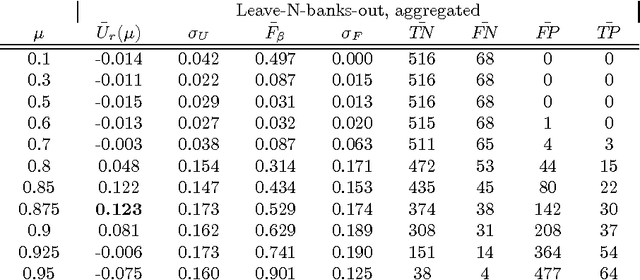
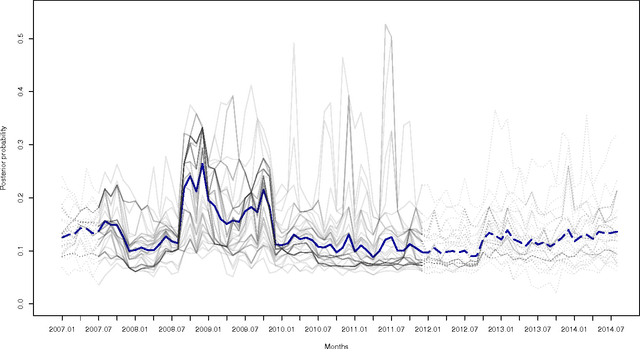
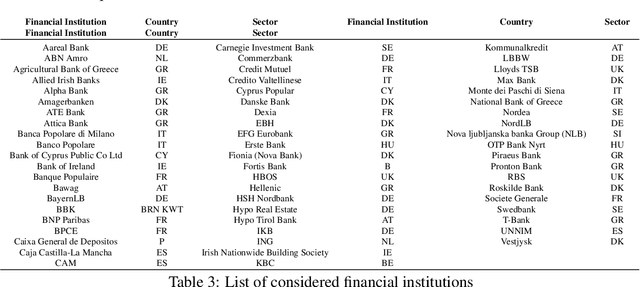
While many models are purposed for detecting the occurrence of significant events in financial systems, the task of providing qualitative detail on the developments is not usually as well automated. We present a deep learning approach for detecting relevant discussion in text and extracting natural language descriptions of events. Supervised by only a small set of event information, comprising entity names and dates, the model is leveraged by unsupervised learning of semantic vector representations on extensive text data. We demonstrate applicability to the study of financial risk based on news (6.6M articles), particularly bank distress and government interventions (243 events), where indices can signal the level of bank-stress-related reporting at the entity level, or aggregated at national or European level, while being coupled with explanations. Thus, we exemplify how text, as timely, widely available and descriptive data, can serve as a useful complementary source of information for financial and systemic risk analytics.
* Forthcoming in Neurocomputing. arXiv admin note: substantial text overlap with arXiv:1507.07870 [in version 1]
Detect & Describe: Deep learning of bank stress in the news
Jul 25, 2015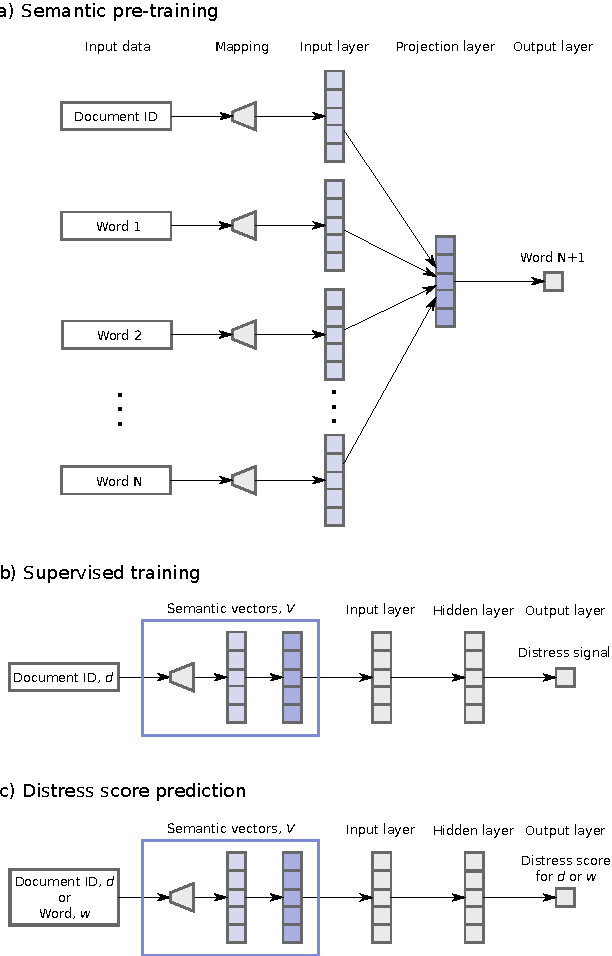
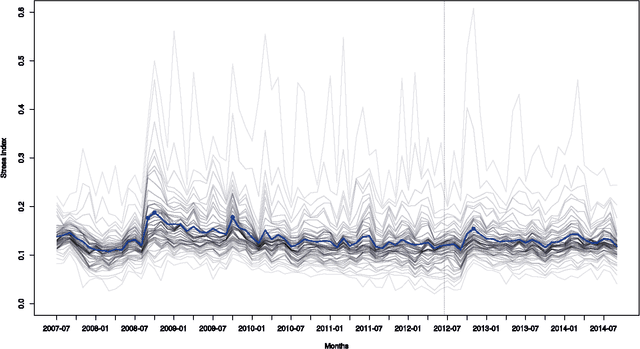
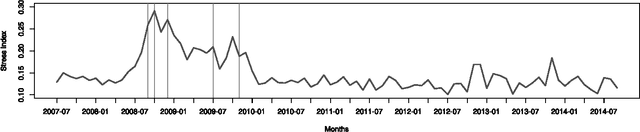
News is a pertinent source of information on financial risks and stress factors, which nevertheless is challenging to harness due to the sparse and unstructured nature of natural text. We propose an approach based on distributional semantics and deep learning with neural networks to model and link text to a scarce set of bank distress events. Through unsupervised training, we learn semantic vector representations of news articles as predictors of distress events. The predictive model that we learn can signal coinciding stress with an aggregated index at bank or European level, while crucially allowing for automatic extraction of text descriptions of the events, based on passages with high stress levels. The method offers insight that models based on other types of data cannot provide, while offering a general means for interpreting this type of semantic-predictive model. We model bank distress with data on 243 events and 6.6M news articles for 101 large European banks.
Interactive Visual Exploration of Topic Models using Graphs
Nov 27, 2014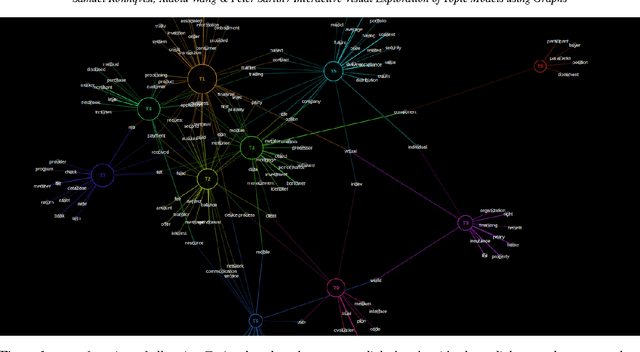
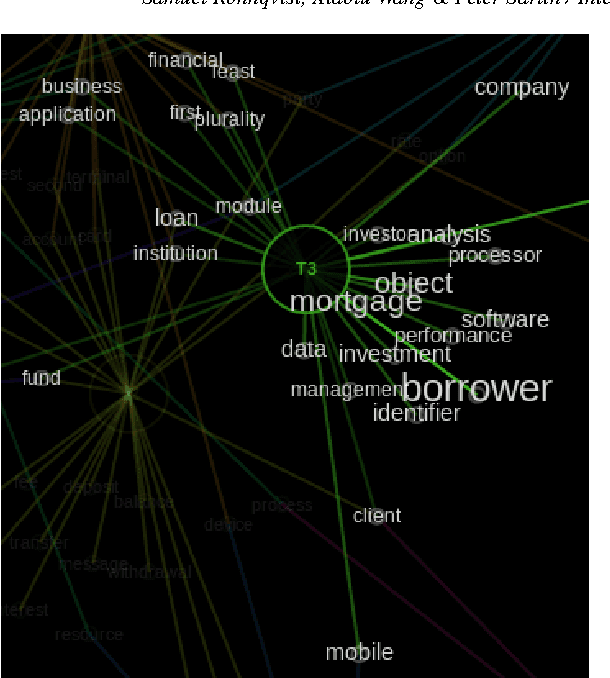
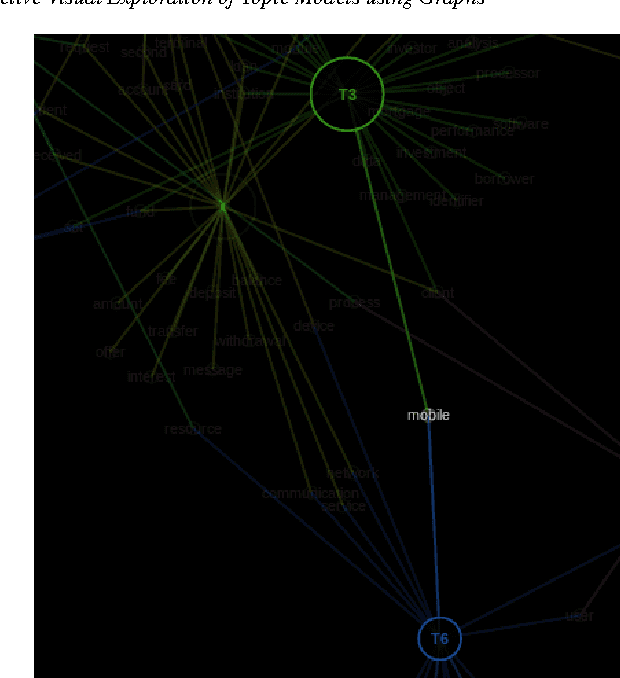
Probabilistic topic modeling is a popular and powerful family of tools for uncovering thematic structure in large sets of unstructured text documents. While much attention has been directed towards the modeling algorithms and their various extensions, comparatively few studies have concerned how to present or visualize topic models in meaningful ways. In this paper, we present a novel design that uses graphs to visually communicate topic structure and meaning. By connecting topic nodes via descriptive keyterms, the graph representation reveals topic similarities, topic meaning and shared, ambiguous keyterms. At the same time, the graph can be used for information retrieval purposes, to find documents by topic or topic subsets. To exemplify the utility of the design, we illustrate its use for organizing and exploring corpora of financial patents.
Automated and Weighted Self-Organizing Time Maps
Nov 22, 2013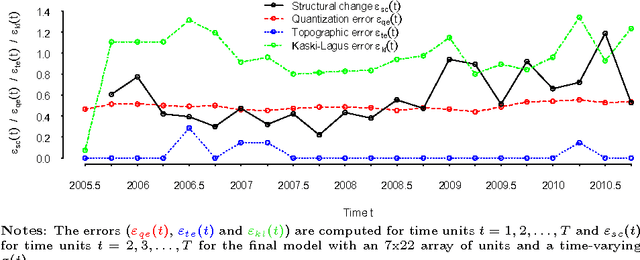
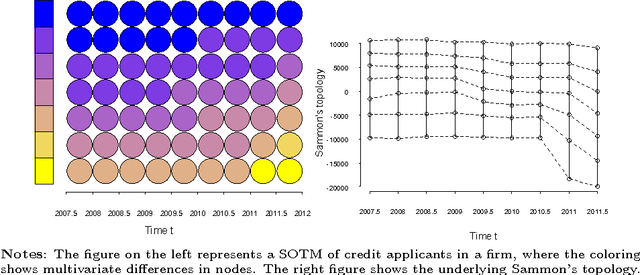
This paper proposes schemes for automated and weighted Self-Organizing Time Maps (SOTMs). The SOTM provides means for a visual approach to evolutionary clustering, which aims at producing a sequence of clustering solutions. This task we denote as visual dynamic clustering. The implication of an automated SOTM is not only a data-driven parametrization of the SOTM, but also the feature of adjusting the training to the characteristics of the data at each time step. The aim of the weighted SOTM is to improve learning from more trustworthy or important data with an instance-varying weight. The schemes for automated and weighted SOTMs are illustrated on two real-world datasets: (i) country-level risk indicators to measure the evolution of global imbalances, and (ii) credit applicant data to measure the evolution of firm-level credit risks.
Cluster coloring of the Self-Organizing Map: An information visualization perspective
Jun 17, 2013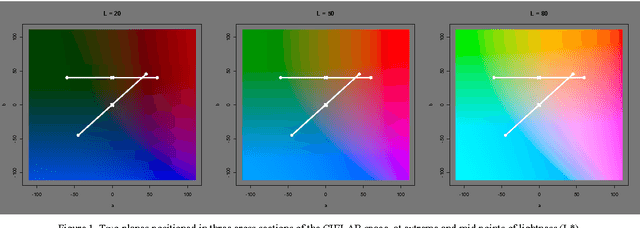
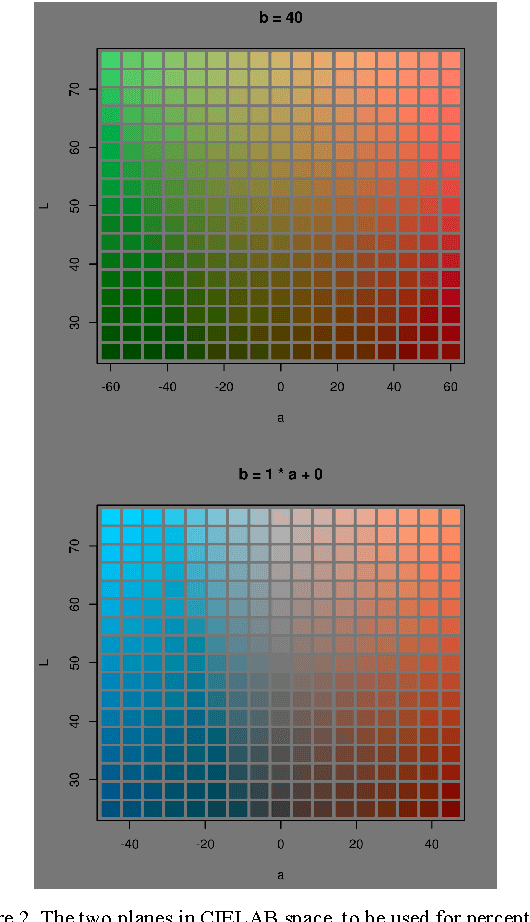
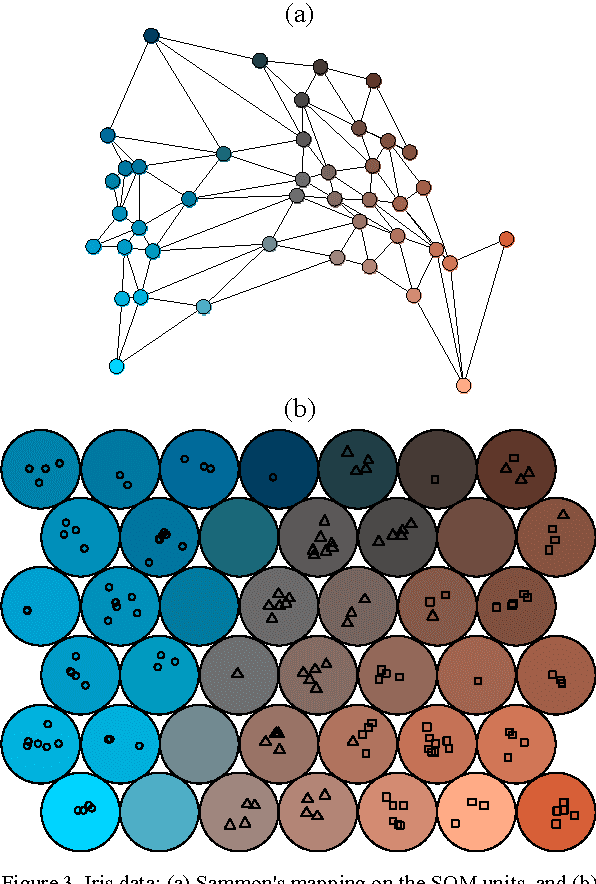
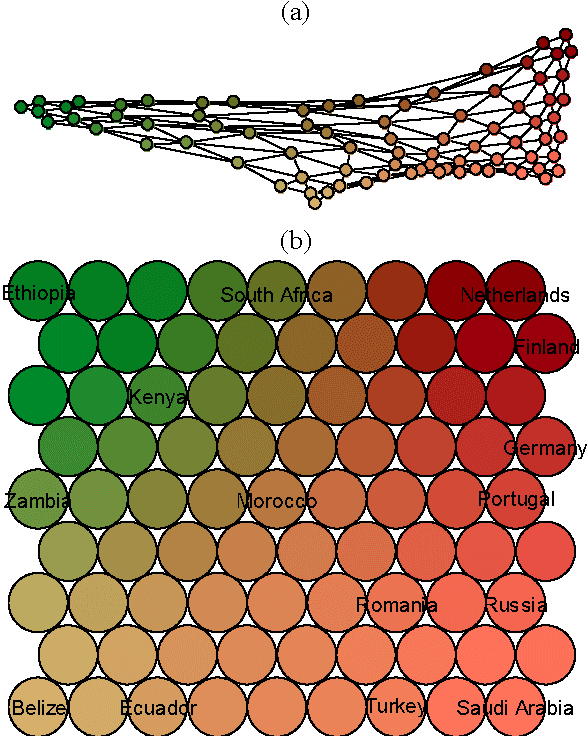
This paper takes an information visualization perspective to visual representations in the general SOM paradigm. This involves viewing SOM-based visualizations through the eyes of Bertin's and Tufte's theories on data graphics. The regular grid shape of the Self-Organizing Map (SOM), while being a virtue for linking visualizations to it, restricts representation of cluster structures. From the viewpoint of information visualization, this paper provides a general, yet simple, solution to projection-based coloring of the SOM that reveals structures. First, the proposed color space is easy to construct and customize to the purpose of use, while aiming at being perceptually correct and informative through two separable dimensions. Second, the coloring method is not dependent on any specific method of projection, but is rather modular to fit any objective function suitable for the task at hand. The cluster coloring is illustrated on two datasets: the iris data, and welfare and poverty indicators.
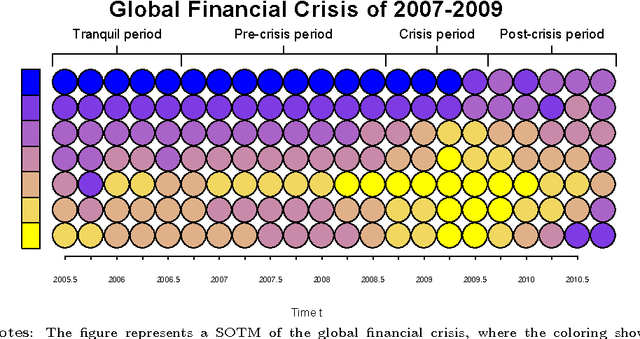
Self-Organizing Time Map: An Abstraction of Temporal Multivariate Patterns
Aug 09, 2012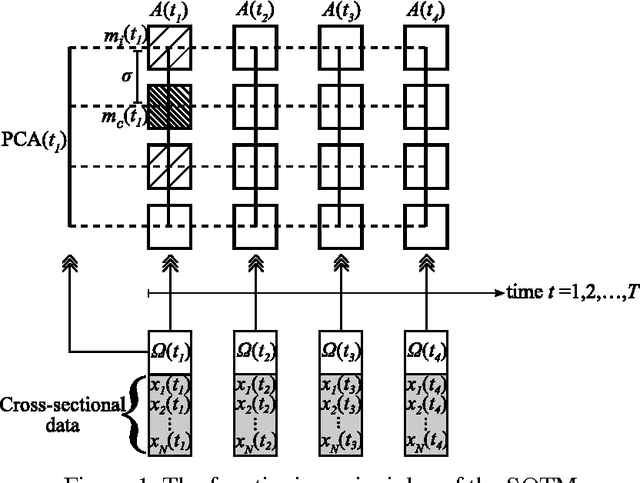
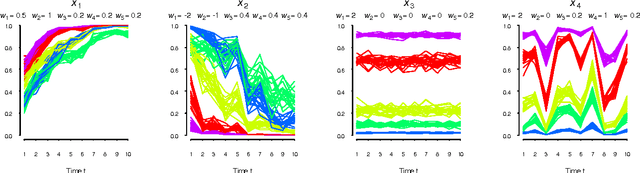
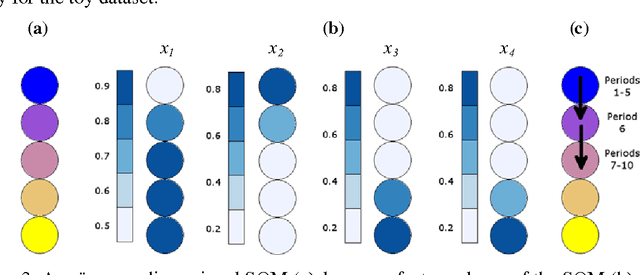
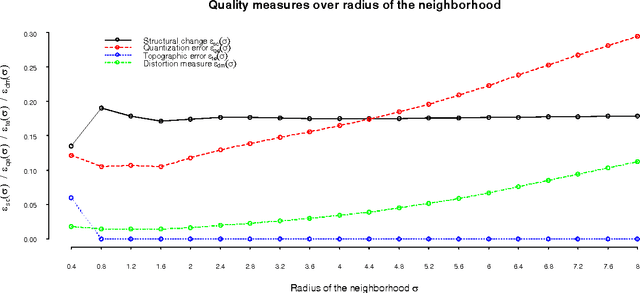
This paper adopts and adapts Kohonen's standard Self-Organizing Map (SOM) for exploratory temporal structure analysis. The Self-Organizing Time Map (SOTM) implements SOM-type learning to one-dimensional arrays for individual time units, preserves the orientation with short-term memory and arranges the arrays in an ascending order of time. The two-dimensional representation of the SOTM attempts thus twofold topology preservation, where the horizontal direction preserves time topology and the vertical direction data topology. This enables discovering the occurrence and exploring the properties of temporal structural changes in data. For representing qualities and properties of SOTMs, we adapt measures and visualizations from the standard SOM paradigm, as well as introduce a measure of temporal structural changes. The functioning of the SOTM, and its visualizations and quality and property measures, are illustrated on artificial toy data. The usefulness of the SOTM in a real-world setting is shown on poverty, welfare and development indicators.