 Add to Chrome
 Add to Firefox
 Add to Edge
A Multivariate Statistical Framework for Detection, Classification and Pre-localization of Anomalies in Water Distribution Networks
Dec 17, 2025


This paper presents a unified framework, for the detection, classification, and preliminary localization of anomalies in water distribution networks using multivariate statistical analysis. The approach, termed SICAMS (Statistical Identification and Classification of Anomalies in Mahalanobis Space), processes heterogeneous pressure and flow sensor data through a whitening transformation to eliminate spatial correlations among measurements. Based on the transformed data, the Hotelling's $T^2$ statistic is constructed, enabling the formulation of anomaly detection as a statistical hypothesis test of network conformity to normal operating conditions. It is shown that Hotelling's $T^2$ statistic can serve as an integral indicator of the overall "health" of the system, exhibiting correlation with total leakage volume, and thereby enabling approximate estimation of water losses via a regression model. A heuristic algorithm is developed to analyze the $T^2$ time series and classify detected anomalies into abrupt leaks, incipient leaks, and sensor malfunctions. Furthermore, a coarse leak localization method is proposed, which ranks sensors according to their statistical contribution and employs Laplacian interpolation to approximate the affected region within the network. Application of the proposed framework to the BattLeDIM L-Town benchmark dataset demonstrates high sensitivity and reliability in leak detection, maintaining robust performance even under multiple leaks. These capabilities make the method applicable to real-world operational environments without the need for a calibrated hydraulic model.
Dynamic Principal Component Analysis: Identifying the Relationship between Multiple Air Pollutants
Aug 10, 2016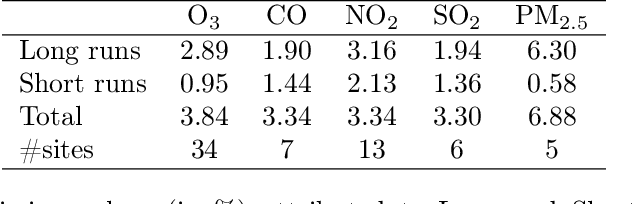
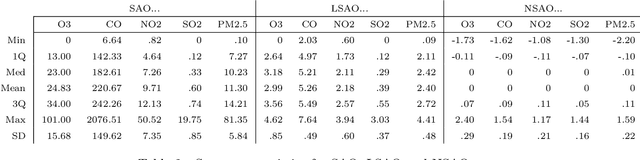
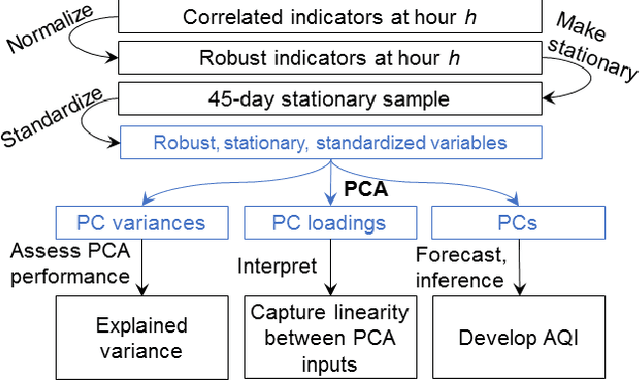
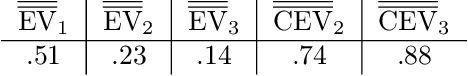
The dynamic nature of air quality chemistry and transport makes it difficult to identify the mixture of air pollutants for a region. In this study of air quality in the Houston metropolitan area we apply dynamic principal component analysis (DPCA) to a normalized multivariate time series of daily concentration measurements of five pollutants (O3, CO, NO2, SO2, PM2.5) from January 1, 2009 through December 31, 2011 for each of the 24 hours in a day. The resulting dynamic components are examined by hour across days for the 3 year period. Diurnal and seasonal patterns are revealed underlining times when DPCA performs best and two principal components (PCs) explain most variability in the multivariate series. DPCA is shown to be superior to static principal component analysis (PCA) in discovery of linear relations among transformed pollutant measurements. DPCA captures the time-dependent correlation structure of the underlying pollutants recorded at up to 34 monitoring sites in the region. In winter mornings the first principal component (PC1) (mainly CO and NO2) explains up to 70% of variability. Augmenting with the second principal component (PC2) (mainly driven by SO2) the explained variability rises to 90%. In the afternoon, O3 gains prominence in the second principal component. The seasonal profile of PCs' contribution to variance loses its distinction in the afternoon, yet cumulatively PC1 and PC2 still explain up to 65% of variability in ambient air data. DPCA provides a strategy for identifying the changing air quality profile for the region studied.