 Add to Chrome
 Add to Firefox
 Add to Edge
Visual Political Communication in a Polarized Society: A Longitudinal Study of Brazilian Presidential Elections on Instagram
Sep 30, 2023In today's digital age, images have emerged as powerful tools for politicians to engage with their voters on social media platforms. Visual content possesses a unique emotional appeal that often leads to increased user engagement. However, research on visual communication remains relatively limited, particularly in the Global South. This study aims to bridge this gap by employing a combination of computational methods and qualitative approach to investigate the visual communication strategies employed in a dataset of 11,263 Instagram posts by 19 Brazilian presidential candidates in 2018 and 2022 national elections. Through two studies, we observed consistent patterns across these candidates on their use of visual political communication. Notably, we identify a prevalence of celebratory and positively toned images. They also exhibit a strong sense of personalization, portraying candidates connected with their voters on a more emotional level. Our research also uncovers unique contextual nuances specific to the Brazilian political landscape. We note a substantial presence of screenshots from news websites and other social media platforms. Furthermore, text-edited images with portrayals emerge as a prominent feature. In light of these results, we engage in a discussion regarding the implications for the broader field of visual political communication. This article serves as a testament to the pivotal role that Instagram has played in shaping the narrative of two fiercely polarized Brazilian elections, casting a revealing light on the ever-evolving dynamics of visual political communication in the digital age. Finally, we propose avenues for future research in the realm of visual political communication.
Chronnet: a network-based model for spatiotemporal data analysis
Apr 23, 2020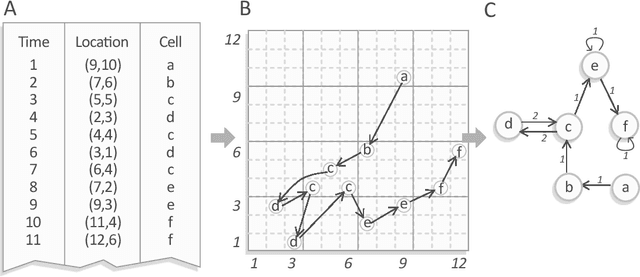
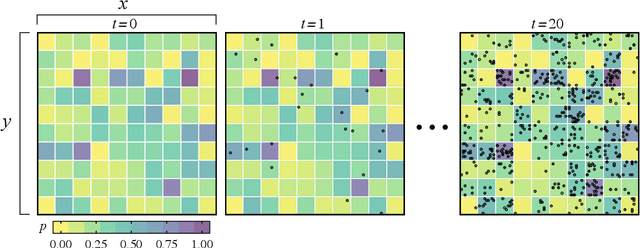
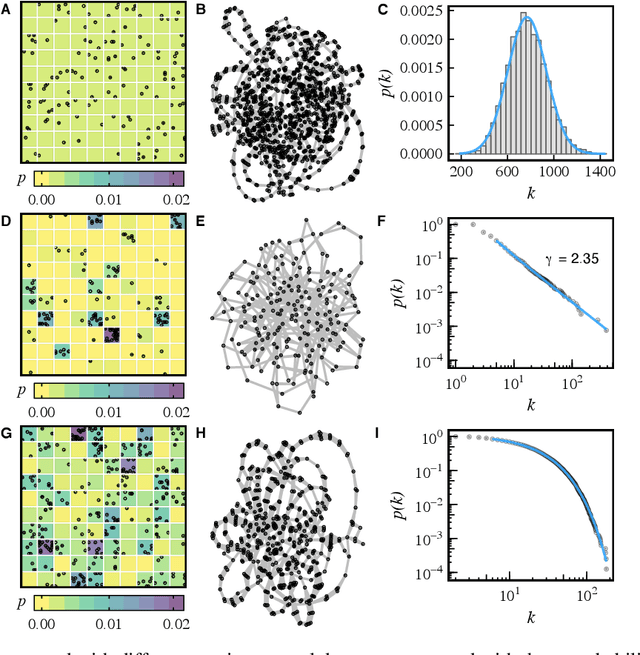
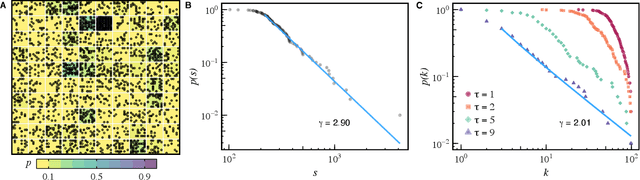
The amount and size of spatiotemporal data sets from different domains have been rapidly increasing in the last years, which demands the development of robust and fast methods to analyze and extract information from them. In this paper, we propose a network-based model for spatiotemporal data analysis called chronnet. It consists of dividing a geometrical space into grid cells represented by nodes connected chronologically. The main goal of this model is to represent consecutive recurrent events between cells with strong links in the network. This representation permits the use of network science and graphing mining tools to extract information from spatiotemporal data. The chronnet construction process is fast, which makes it suitable for large data sets. In this paper, we describe how to use our model considering artificial and real data. For this purpose, we propose an artificial spatiotemporal data set generator to show how chronnets capture not just simple statistics, but also frequent patterns, spatial changes, outliers, and spatiotemporal clusters. Additionally, we analyze a real-world data set composed of global fire detections, in which we describe the frequency of fire events, outlier fire detections, and the seasonal activity, using a single chronnet.