 Add to Chrome
 Add to Firefox
 Add to Edge
Self-Ensembling Vision-Language Models for Chart Data Extraction
May 26, 2026Charts effectively convey quantitative information, but the underlying data are often locked in image form, hindering reuse and analysis. Manually digitizing charts is time-consuming and error-prone, motivating automatic chart-to-table extraction. Recent approaches use specialized vision-language models (VLMs), yet performance still lags on charts with many datapoints or substantial stylistic variation. We propose a VLM self-ensembling method that repeatedly samples multiple tabular outputs from the same VLM for a fixed chart image and aggregates them at the level of individual table cells. We align candidate tables and take per-cell medians over numerical values to produce a more accurate consensus table. Our method also includes convergence detection to stop sampling once the aggregated table stabilizes, and uncertainty estimation based on dispersion across samples to help users assess extraction reliability. Because existing chart extraction benchmarks contain relatively simple plots with limited room for improvement, we introduce WB-ChartExtract, a new benchmark built from World Bank data with more complex and stylistically diverse charts; on average, its charts contain 7 times more datapoints than those in the ChartQA benchmark. Across both ChartQA and WB-ChartExtract, our approach improves extraction accuracy over single-pass VLM outputs, yielding up to 23% relative improvement on WB-ChartExtract after ensembling. More broadly, our method helps unlock tabular data previously siloed in chart images, enabling downstream analysis and reuse.
EpiCurveBench: Evaluating VLMs on Epidemic Curve Digitization
May 26, 2026Chart-to-data extraction with vision-language models (VLMs) is increasingly evaluated on benchmarks that show diminishing headroom (frontier VLMs exceed 89% on ChartQA) and with metrics that treat extracted points as unordered key-value pairs, ignoring the temporal structure of time series and penalizing small alignment shifts as catastrophic failures. We address both gaps with EpiCurveBench, a benchmark of 1,000 real-world epidemic curve images curated from diverse public-health sources, and EpiCurveSimilarity (ECS), an evaluation metric that aligns predicted and ground-truth series via dynamic programming, tolerating local temporal shifts and gaps while penalizing them proportionally. Evaluating six methods--three frontier closed VLMs, one open VLM, and two specialized chart-extraction systems--we find the strongest model reaches only 52.3% ECS, and that ECS spreads the four general-purpose VLMs over a 25-point range where key-value metrics (RMS, SCRM) compress them into a 5-point band. We further validate ECS against four downstream epidemiological summary statistics, finding that higher ECS predicts smaller errors in total counts, peak timing, and peak magnitude, and higher growth-rate fidelity; across all four, ECS correlates 1.5--3.6 times more strongly than Dynamic Time Warping, which lacks a gap penalty and therefore cannot distinguish a truncated prediction from a temporally faithful one. EpiCurveBench targets a high-impact public-health application--unlocking decades of outbreak data trapped in published figures--but the benchmark and metric apply directly to any structured time-series chart-extraction setting.
Guided Deep List: Automating the Generation of Epidemiological Line Lists from Open Sources
Feb 22, 2017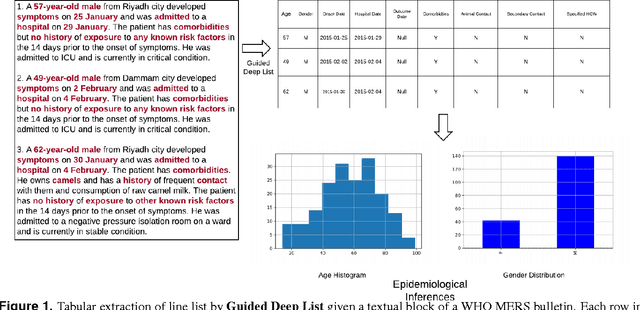
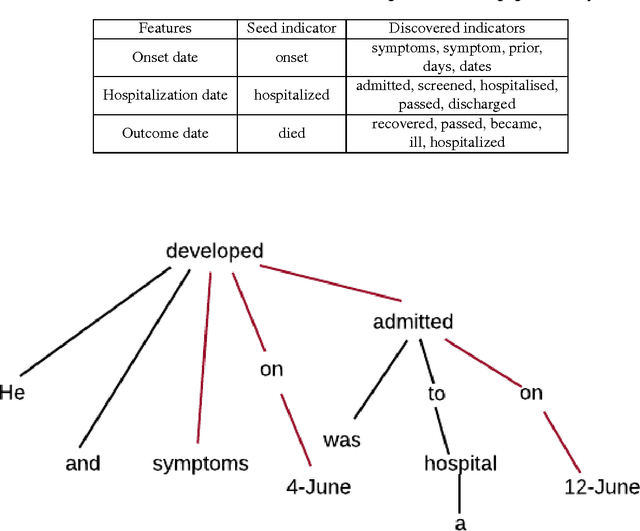
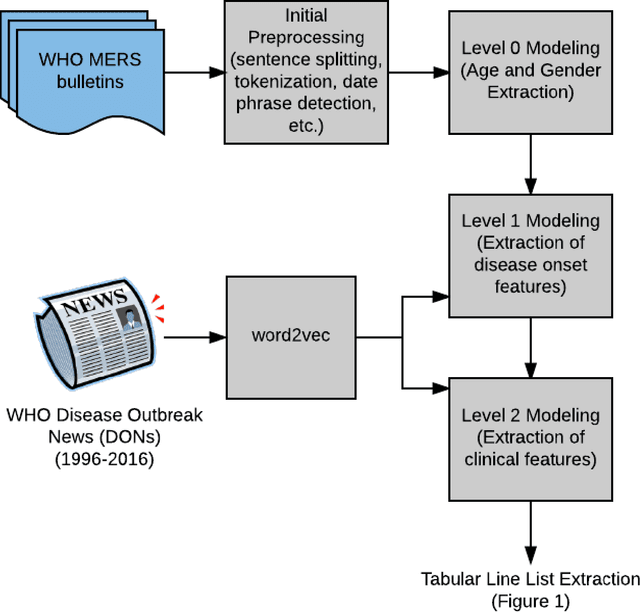
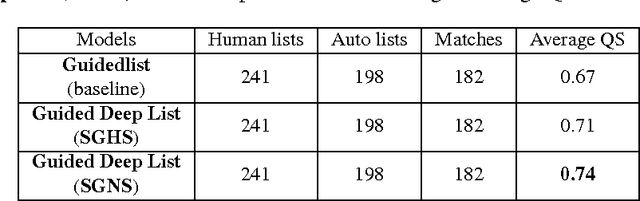
Real-time monitoring and responses to emerging public health threats rely on the availability of timely surveillance data. During the early stages of an epidemic, the ready availability of line lists with detailed tabular information about laboratory-confirmed cases can assist epidemiologists in making reliable inferences and forecasts. Such inferences are crucial to understand the epidemiology of a specific disease early enough to stop or control the outbreak. However, construction of such line lists requires considerable human supervision and therefore, difficult to generate in real-time. In this paper, we motivate Guided Deep List, the first tool for building automated line lists (in near real-time) from open source reports of emerging disease outbreaks. Specifically, we focus on deriving epidemiological characteristics of an emerging disease and the affected population from reports of illness. Guided Deep List uses distributed vector representations (ala word2vec) to discover a set of indicators for each line list feature. This discovery of indicators is followed by the use of dependency parsing based techniques for final extraction in tabular form. We evaluate the performance of Guided Deep List against a human annotated line list provided by HealthMap corresponding to MERS outbreaks in Saudi Arabia. We demonstrate that Guided Deep List extracts line list features with increased accuracy compared to a baseline method. We further show how these automatically extracted line list features can be used for making epidemiological inferences, such as inferring demographics and symptoms-to-hospitalization period of affected individuals.