 Add to Chrome
 Add to Firefox
 Add to Edge
Explainable Outlier Detection for Interval-valued Data
Jun 24, 2026
Explainability is increasingly recognized as a key aspect of outlier detection. However, for complex data structures such as interval-valued data, it remains largely unexplored. Building on an outlier detection framework based on the Interval Minimum Covariance Determinant estimator, we propose a novel approach to explain the outlyingness of interval-valued observations using the concept of the Shapley value. We derive a closed-form expression for the Shapley value of the squared robust Interval-Mahalanobis distance, enabling efficient computation of variable contributions. This formulation allows for a fine-grained interpretation of outliers, providing a detailed decomposition into contributions from centers, ranges, and cross-terms of the interval-valued observations. Moreover, the Shapley value is closely connected to the concept of cellwise outliers, as it can help identify variable-specific outliers that may not be evident at multivariate level. We further extend the framework through the Shapley interaction index to capture pairwise variable interactions driving atypical behavior. The practical utility of the proposed approach is illustrated through two real-world datasets.

Interval Fisher's Discriminant Analysis and Visualisation
Dec 12, 2025
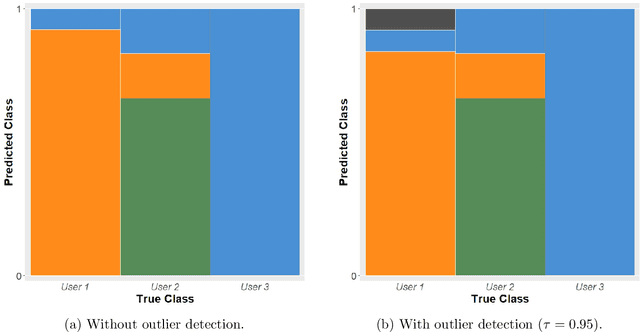
In Data Science, entities are typically represented by single valued measurements. Symbolic Data Analysis extends this framework to more complex structures, such as intervals and histograms, that express internal variability. We propose an extension of multiclass Fisher's Discriminant Analysis to interval-valued data, using Moore's interval arithmetic and the Mallows' distance. Fisher's objective function is generalised to consider simultaneously the contributions of the centres and the ranges of intervals and is numerically maximised. The resulting discriminant directions are then used to classify interval-valued observations.To support visual assessment, we adapt the class map, originally introduced for conventional data, to classifiers that assign labels through minimum distance rules. We also extend the silhouette plot to this setting and use stacked mosaic plots to complement the visual display of class assignments. Together, these graphical tools provide insight into classifier performance and the strength of class membership. Applications to real datasets illustrate the proposed methodology and demonstrate its value in interpreting classification results for interval-valued data.