 Add to Chrome
 Add to Firefox
 Add to Edge
Fusion and Grouping Strategies in Deep Learning for Local Climate Zone Classification of Multimodal Remote Sensing Data
Mar 04, 2026Local Climate Zones (LCZs) give a zoning map to study urban structures and land use and analyze the impact of urbanization on local climate. Multimodal remote sensing enables LCZ classification, for which data fusion is significant for improving accuracy owing to the data complexity. However, there is a gap in a comprehensive analysis of the fusion mechanisms used in their deep learning (DL) classifier architectures. This study analyzes different fusion strategies in the multi-class LCZ classification models for multimodal data and grouping strategies based on inherent data characteristics. The different models involving Convolutional Neural Networks (CNNs) include: (i) baseline hybrid fusion (FM1), (ii) with self- and cross-attention mechanisms (FM2), (iii) with the multi-scale Gaussian filtered images (FM3), and (iv) weighted decision-level fusion (FM4). Ablation experiments are conducted to study the pixel-, feature-, and decision-level fusion effects in the model performance. Grouping strategies include band grouping (BG) within the data modalities and label merging (LM) in the ground truth. Our analysis is exclusively done on the So2Sat LCZ42 dataset, which consists of Synthetic Aperture Radar (SAR) and Multispectral Imaging (MSI) image pairs. Our results show that FM1 consistently outperforms simple fusion methods. FM1 with BG and LM is found to be the most effective approach among all fusion strategies, giving an overall accuracy of 76.6\%. Importantly, our study highlights the effect of these strategies in improving prediction accuracy for the underrepresented classes. Our code and processed datasets are available at https://github.com/GVCL/LCZC-MultiModalHybridFusion
Evolution of Data-driven Single- and Multi-Hazard Susceptibility Mapping and Emergence of Deep Learning Methods
Feb 13, 2025


Data-driven susceptibility mapping of natural hazards has harnessed the advances in classification methods used on heterogeneous sources represented as raster images. Susceptibility mapping is an important step towards risk assessment for any natural hazard. Increasingly, multiple hazards co-occur spatially, temporally, or both, which calls for an in-depth study on multi-hazard susceptibility mapping. In recent years, single-hazard susceptibility mapping algorithms have become well-established and have been extended to multi-hazard susceptibility mapping. Deep learning is also emerging as a promising method for single-hazard susceptibility mapping. Here, we discuss the evolution of methods for a single hazard, their extensions to multi-hazard maps as a late fusion of decisions, and the use of deep learning methods in susceptibility mapping. We finally propose a vision for adapting data fusion strategies in multimodal deep learning to multi-hazard susceptibility mapping. From the background study of susceptibility methods, we demonstrate that deep learning models are promising, untapped methods for multi-hazard susceptibility mapping. Data fusion strategies provide a larger space of deep learning models applicable to multi-hazard susceptibility mapping.
CCESAR: Coastline Classification-Extraction From SAR Images Using CNN-U-Net Combination
Jan 21, 2025


In this article, we improve the deep learning solution for coastline extraction from Synthetic Aperture Radar (SAR) images by proposing a two-stage model involving image classification followed by segmentation. We hypothesize that a single segmentation model usually used for coastline detection is insufficient to characterize different coastline types. We demonstrate that the need for a two-stage workflow prevails through different compression levels of these images. Our results from experiments using a combination of CNN and U-Net models on Sentinel-1 images show that the two-stage workflow, coastline classification-extraction from SAR images (CCESAR) outperforms a single U-Net segmentation model.
Tensor Fields for Data Extraction from Chart Images: Bar Charts and Scatter Plots
Oct 05, 2020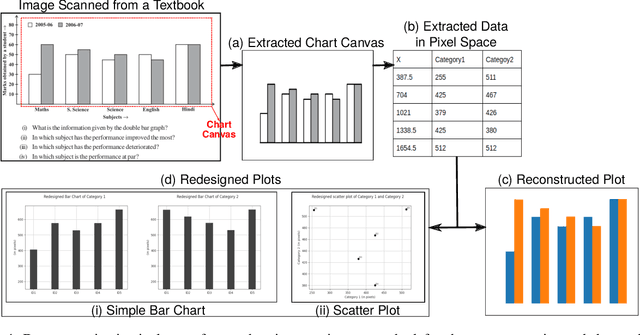
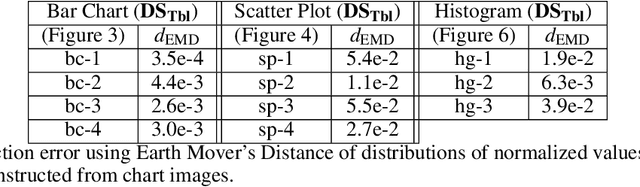
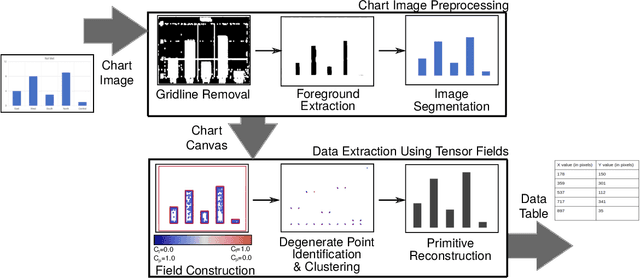
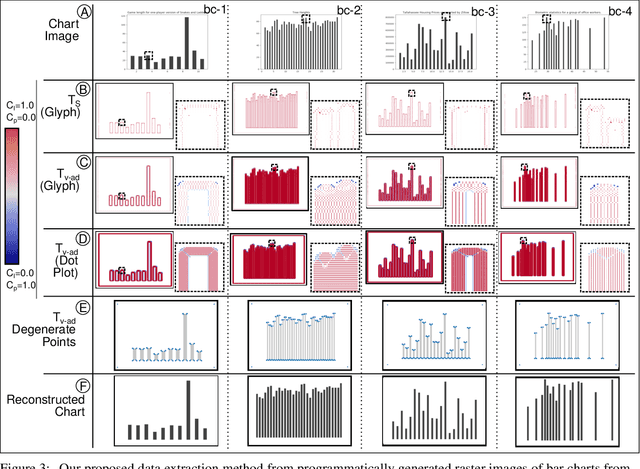
Charts are an essential part of both graphicacy (graphical literacy), and statistical literacy. As chart understanding has become increasingly relevant in data science, automating chart analysis by processing raster images of the charts has become a significant problem. Automated chart reading involves data extraction and contextual understanding of the data from chart images. In this paper, we perform the first step of determining the computational model of chart images for data extraction for selected chart types, namely, bar charts, and scatter plots. We demonstrate the use of positive semidefinite second-order tensor fields as an effective model. We identify an appropriate tensor field as the model and propose a methodology for the use of its degenerate point extraction for data extraction from chart images. Our results show that tensor voting is effective for data extraction from bar charts and scatter plots, and histograms, as a special case of bar charts.
Augmented Semantic Signatures of Airborne LiDAR Point Clouds for Determining Change in Time-varying Data
Apr 29, 2020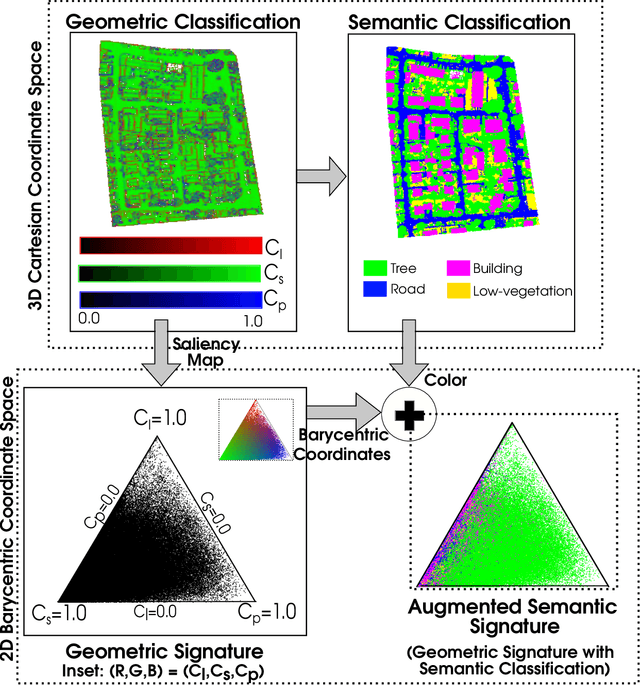
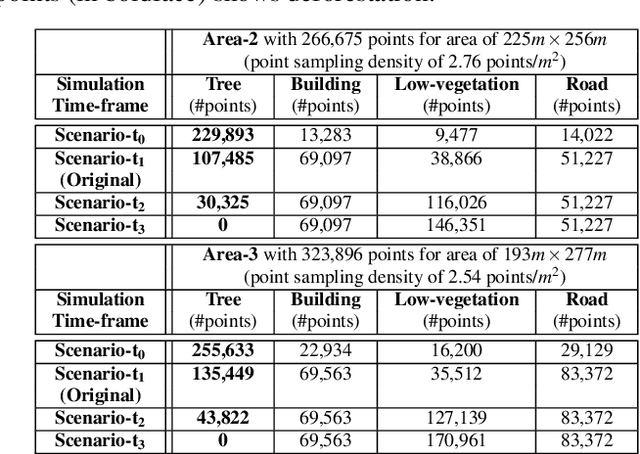
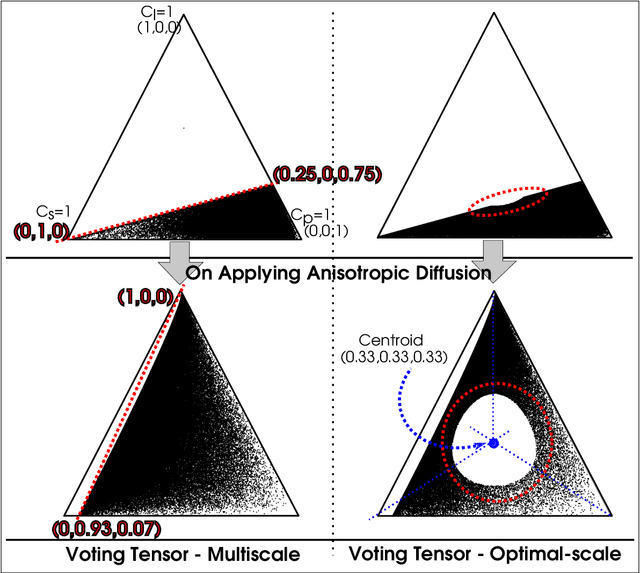
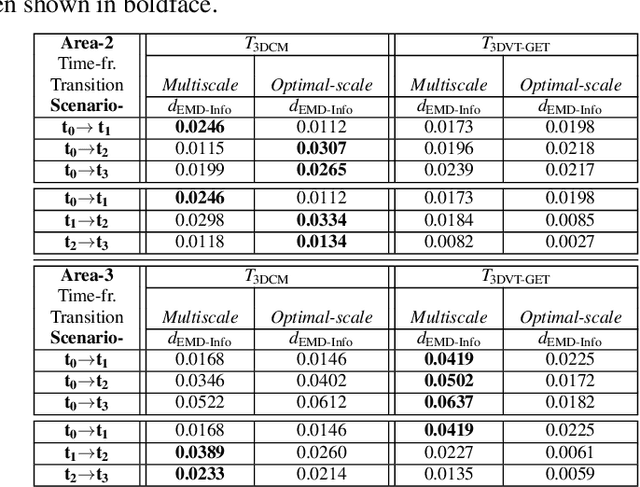
LiDAR point clouds provide rich geometric information, which is particularly useful for the analysis of complex scenes of urban regions. Finding structural and semantic differences between two different three-dimensional point clouds, say, of the same region but acquired at different time instances is an important problem. Usually, the data capture has inconsistencies when taken at different time instances, e.g., sampling densities, and the orientation of the flight path. Hence, change detection involves computationally expensive registration and segmentation. We are interested in capturing the relative differences in the geometric uncertainty and semantic content of the point cloud without the registration process. Hence, we propose an orientation-invariant geometric signature of the point cloud, which integrates its probabilistic geometric and semantic classifications. We study different properties of the geometric signature, which are image-based encoding of geometric uncertainty and semantic content. We explore different metrics to determine differences between these signatures, which in turn compare point clouds without performing point-to-point registration. We have observed that a point cloud with four semantic classes, namely, buildings, trees, road, and low-vegetation, that the tree class shows a characteristic pattern. Thus, we use a case study of airborne LiDAR point clouds where the visual and the quantitative comparisons of the geometric signatures of point clouds are useful in demonstrating changes during a thematic event, such as progressive deforestation, in the topography of an urban region. Our results show that the differences in the signatures corroborate with the geometric and semantic differences of the point clouds.