 Add to Chrome
 Add to Firefox
 Add to Edge
Superstudent intelligence in thermodynamics
Jun 11, 2025In this short note, we report and analyze a striking event: OpenAI's large language model o3 has outwitted all students in a university exam on thermodynamics. The thermodynamics exam is a difficult hurdle for most students, where they must show that they have mastered the fundamentals of this important topic. Consequently, the failure rates are very high, A-grades are rare - and they are considered proof of the students' exceptional intellectual abilities. This is because pattern learning does not help in the exam. The problems can only be solved by knowledgeably and creatively combining principles of thermodynamics. We have given our latest thermodynamics exam not only to the students but also to OpenAI's most powerful reasoning model, o3, and have assessed the answers of o3 exactly the same way as those of the students. In zero-shot mode, the model o3 solved all problems correctly, better than all students who took the exam; its overall score was in the range of the best scores we have seen in more than 10,000 similar exams since 1985. This is a turning point: machines now excel in complex tasks, usually taken as proof of human intellectual capabilities. We discuss the consequences this has for the work of engineers and the education of future engineers.
Hierarchical Matrix Completion for the Prediction of Properties of Binary Mixtures
Oct 08, 2024Predicting the thermodynamic properties of mixtures is crucial for process design and optimization in chemical engineering. Machine learning (ML) methods are gaining increasing attention in this field, but experimental data for training are often scarce, which hampers their application. In this work, we introduce a novel generic approach for improving data-driven models: inspired by the ancient rule "similia similibus solvuntur", we lump components that behave similarly into chemical classes and model them jointly in the first step of a hierarchical approach. While the information on class affiliations can stem in principle from any source, we demonstrate how classes can reproducibly be defined based on mixture data alone by agglomerative clustering. The information from this clustering step is then used as an informed prior for fitting the individual data. We demonstrate the benefits of this approach by applying it in connection with a matrix completion method (MCM) for predicting isothermal activity coefficients at infinite dilution in binary mixtures. Using clustering leads to significantly improved predictions compared to an MCM without clustering. Furthermore, the chemical classes learned from the clustering give exciting insights into what matters on the molecular level for modeling given mixture properties.
Machine learning-based optimization workflow of the homogeneity of spunbond nonwovens with human validation
Apr 15, 2024In the last ten years, the average annual growth rate of nonwoven production was 4%. In 2020 and 2021, nonwoven production has increased even further due to the huge demand for nonwoven products needed for protective clothing such as FFP2 masks to combat the COVID19 pandemic. Optimizing the production process is still a challenge due to its high nonlinearity. In this paper, we present a machine learning-based optimization workflow aimed at improving the homogeneity of spunbond nonwovens. The optimization workflow is based on a mathematical model that simulates the microstructures of nonwovens. Based on trainingy data coming from this simulator, different machine learning algorithms are trained in order to find a surrogate model for the time-consuming simulator. Human validation is employed to verify the outputs of machine learning algorithms by assessing the aesthetics of the nonwovens. We include scientific and expert knowledge into the training data to reduce the computational costs involved in the optimization process. We demonstrate the necessity and effectiveness of our workflow in optimizing the homogeneity of nonwovens.
Deep Anomaly Detection on Tennessee Eastman Process Data
Mar 10, 2023This paper provides the first comprehensive evaluation and analysis of modern (deep-learning) unsupervised anomaly detection methods for chemical process data. We focus on the Tennessee Eastman process dataset, which has been a standard litmus test to benchmark anomaly detection methods for nearly three decades. Our extensive study will facilitate choosing appropriate anomaly detection methods in industrial applications.
Attribute-based Explanations of Non-Linear Embeddings of High-Dimensional Data
Jul 28, 2021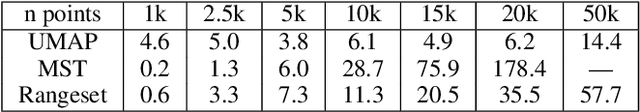
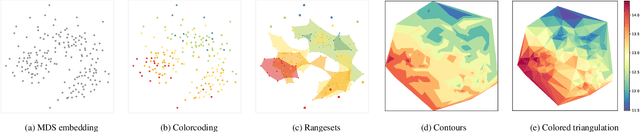
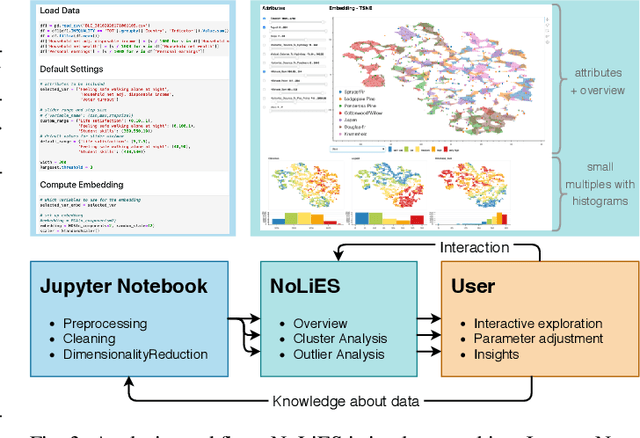
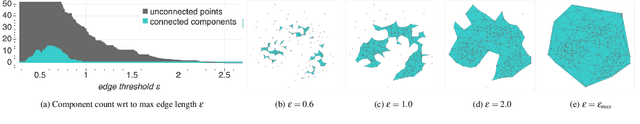
Embeddings of high-dimensional data are widely used to explore data, to verify analysis results, and to communicate information. Their explanation, in particular with respect to the input attributes, is often difficult. With linear projects like PCA the axes can still be annotated meaningfully. With non-linear projections this is no longer possible and alternative strategies such as attribute-based color coding are required. In this paper, we review existing augmentation techniques and discuss their limitations. We present the Non-Linear Embeddings Surveyor (NoLiES) that combines a novel augmentation strategy for projected data (rangesets) with interactive analysis in a small multiples setting. Rangesets use a set-based visualization approach for binned attribute values that enable the user to quickly observe structure and detect outliers. We detail the link between algebraic topology and rangesets and demonstrate the utility of NoLiES in case studies with various challenges (complex attribute value distribution, many attributes, many data points) and a real-world application to understand latent features of matrix completion in thermodynamics.
Visual Probing and Correction of Object Recognition Models with Interactive user feedback
Dec 29, 2020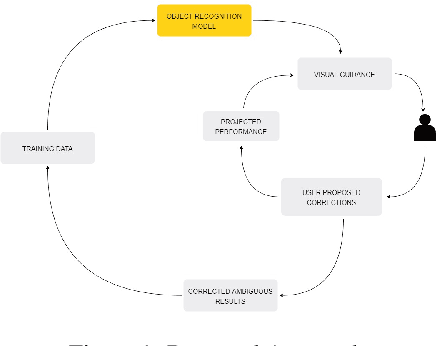
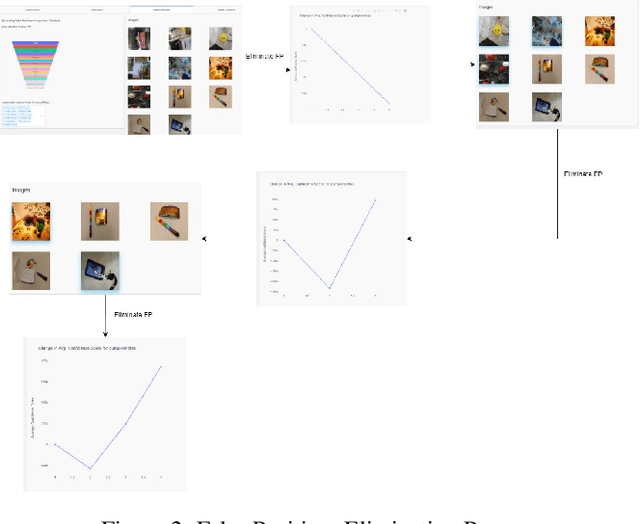
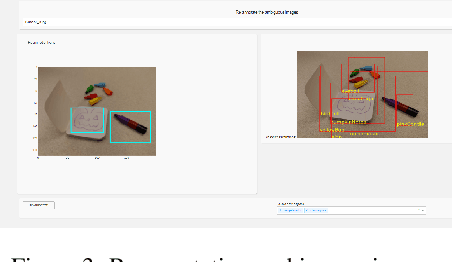
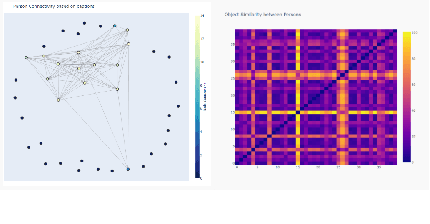
With the advent of state-of-the-art machine learning and deep learning technologies, several industries are moving towards the field. Applications of such technologies are highly diverse ranging from natural language processing to computer vision. Object recognition is one such area in the computer vision domain. Although proven to perform with high accuracy, there are still areas where such models can be improved. This is in-fact highly important in real-world use cases like autonomous driving or cancer detection, that are highly sensitive and expect such technologies to have almost no uncertainties. In this paper, we attempt to visualise the uncertainties in object recognition models and propose a correction process via user feedback. We further demonstrate our approach on the data provided by the VAST 2020 Mini-Challenge 2.
Topological Machine Learning with Persistence Indicator Functions
Jul 31, 2019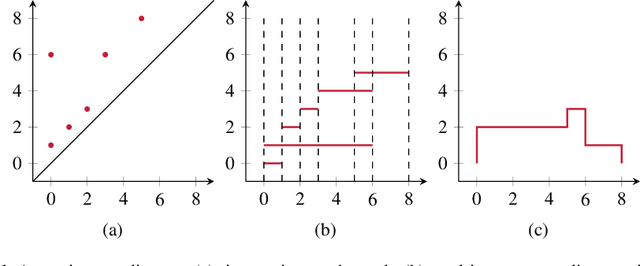
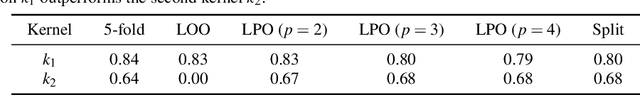
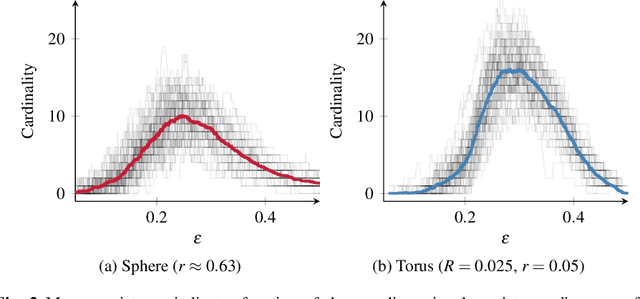
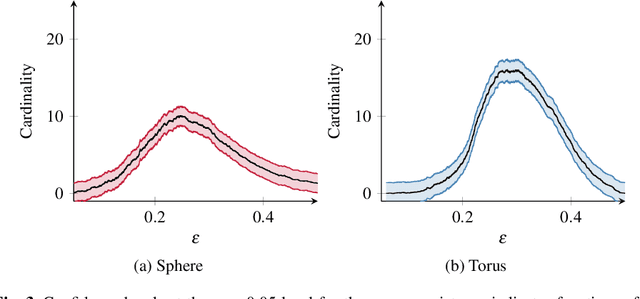
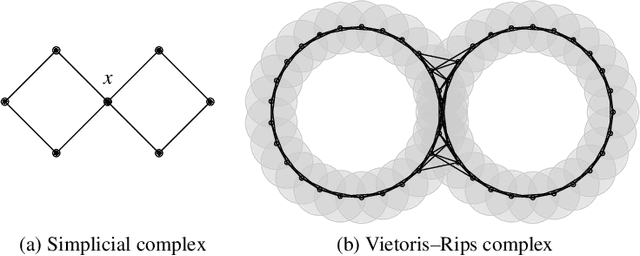
Techniques from computational topology, in particular persistent homology, are becoming increasingly relevant for data analysis. Their stable metrics permit the use of many distance-based data analysis methods, such as multidimensional scaling, while providing a firm theoretical ground. Many modern machine learning algorithms, however, are based on kernels. This paper presents persistence indicator functions (PIFs), which summarize persistence diagrams, i.e., feature descriptors in topological data analysis. PIFs can be calculated and compared in linear time and have many beneficial properties, such as the availability of a kernel-based similarity measure. We demonstrate their usage in common data analysis scenarios, such as confidence set estimation and classification of complex structured data.
Persistent Intersection Homology for the Analysis of Discrete Data
Jul 31, 2019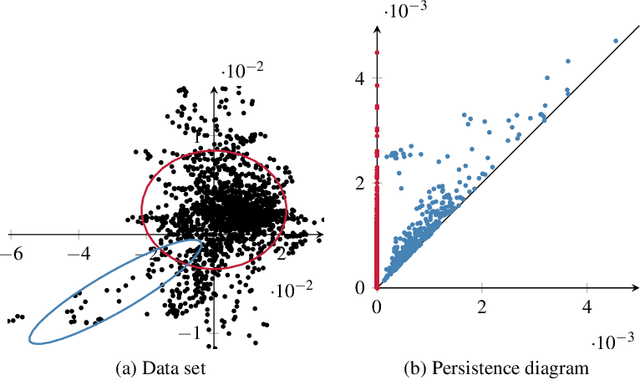
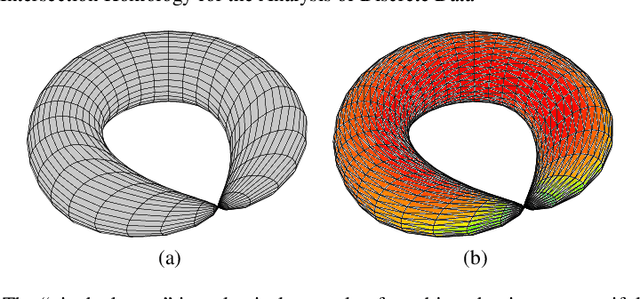
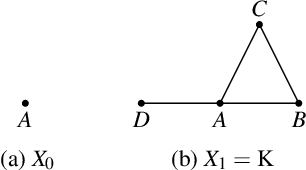
Topological data analysis is becoming increasingly relevant to support the analysis of unstructured data sets. A common assumption in data analysis is that the data set is a sample---not necessarily a uniform one---of some high-dimensional manifold. In such cases, persistent homology can be successfully employed to extract features, remove noise, and compare data sets. The underlying problems in some application domains, however, turn out to represent multiple manifolds with different dimensions. Algebraic topology typically analyzes such problems using intersection homology, an extension of homology that is capable of handling configurations with singularities. In this paper, we describe how the persistent variant of intersection homology can be used to assist data analysis in visualization. We point out potential pitfalls in approximating data sets with singularities and give strategies for resolving them.