 Add to Chrome
 Add to Firefox
 Add to Edge
Coarse- and fine-scale geometric information content of Multiclass Classification and implied Data-driven Intelligence
Apr 15, 2021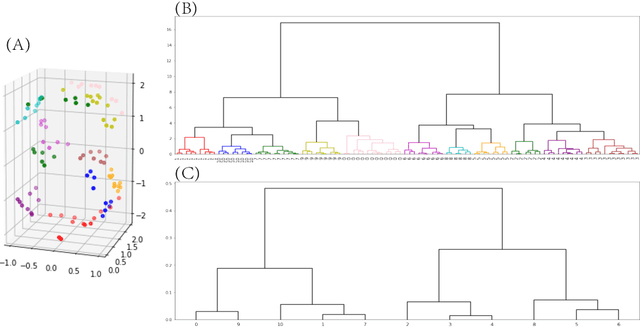
Under any Multiclass Classification (MCC) setting defined by a collection of labeled point-cloud specified by a feature-set, we extract only stochastic partial orderings from all possible triplets of point-cloud without explicitly measuring the three cloud-to-cloud distances. We demonstrate that such a collective of partial ordering can efficiently compute a label embedding tree geometry on the Label-space. This tree in turn gives rise to a predictive graph, or a network with precisely weighted linkages. Such two multiscale geometries are taken as the coarse scale information content of MCC. They indeed jointly shed lights on explainable knowledge on why and how labeling comes about and facilitates error-free prediction with potential multiple candidate labels supported by data. For revealing within-label heterogeneity, we further undergo labeling naturally found clusters within each point-cloud, and likewise derive multiscale geometry as its fine-scale information content contained in data. This fine-scale endeavor shows that our computational proposal is indeed scalable to a MCC setting having a large label-space. Overall the computed multiscale collective of data-driven patterns and knowledge will serve as a basis for constructing visible and explainable subject matter intelligence regarding the system of interest.
* 15 pages, 5 figures
Categorical exploratory data analysis on goodness-of-fit issues
Dec 04, 2020


If the aphorism "All models are wrong"- George Box, continues to be true in data analysis, particularly when analyzing real-world data, then we should annotate this wisdom with visible and explainable data-driven patterns. Such annotations can critically shed invaluable light on validity as well as limitations of statistical modeling as a data analysis approach. In an effort to avoid holding our real data to potentially unattainable or even unrealistic theoretical structures, we propose to utilize the data analysis paradigm called Categorical Exploratory Data Analysis (CEDA). We illustrate the merits of this proposal with two real-world data sets from the perspective of goodness-of-fit. In both data sets, the Normal distribution's bell shape seemingly fits rather well by first glance. We apply CEDA to bring out where and how each data fits or deviates from the model shape via several important distributional aspects. We also demonstrate that CEDA affords a version of tree-based p-value, and compare it with p-values based on traditional statistical approaches. Along our data analysis, we invest computational efforts in making graphic display to illuminate the advantages of using CEDA as one primary way of data analysis in Data Science education.
Extreme-K categorical samples problem
Jul 29, 2020


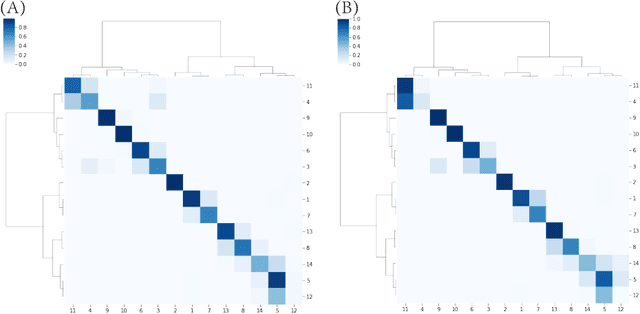
With histograms as its foundation, we develop Categorical Exploratory Data Analysis (CEDA) under the extreme-$K$ sample problem, and illustrate its universal applicability through four 1D categorical datasets. Given a sizable $K$, CEDA's ultimate goal amounts to discover by data's information content via carrying out two data-driven computational tasks: 1) establish a tree geometry upon $K$ populations as a platform for discovering a wide spectrum of patterns among populations; 2) evaluate each geometric pattern's reliability. In CEDA developments, each population gives rise to a row vector of categories proportions. Upon the data matrix's row-axis, we discuss the pros and cons of Euclidean distance against its weighted version for building a binary clustering tree geometry. The criterion of choice rests on degrees of uniformness in column-blocks framed by this binary clustering tree. Each tree-leaf (population) is then encoded with a binary code sequence, so is tree-based pattern. For evaluating reliability, we adopt row-wise multinomial randomness to generate an ensemble of matrix mimicries, so an ensemble of mimicked binary trees. Reliability of any observed pattern is its recurrence rate within the tree ensemble. A high reliability value means a deterministic pattern. Our four applications of CEDA illuminate four significant aspects of extreme-$K$ sample problems.
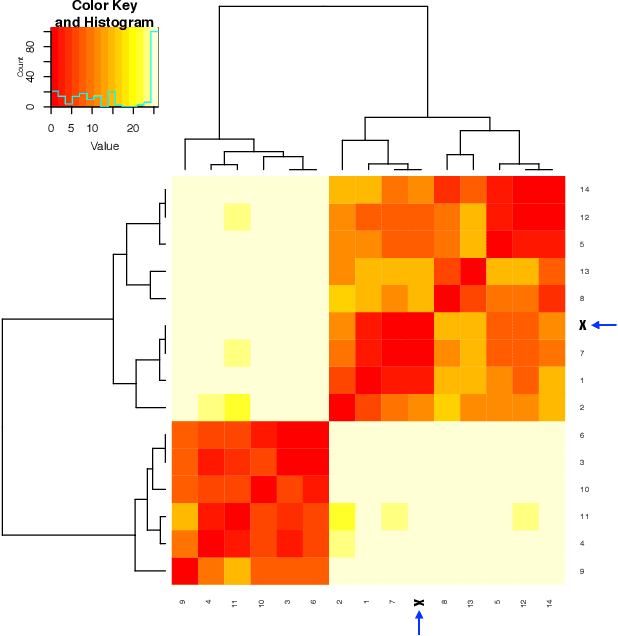
Color-complexity enabled exhaustive color-dots identification and spatial patterns testing in images
Jul 28, 2020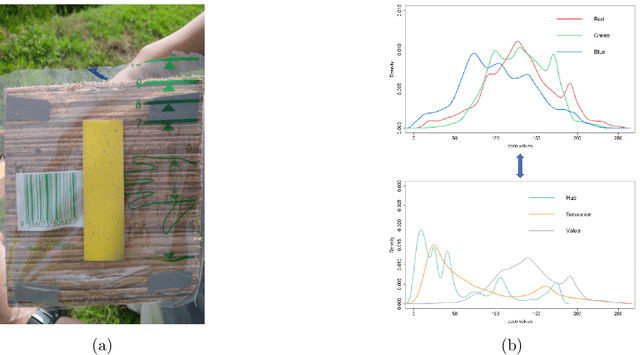
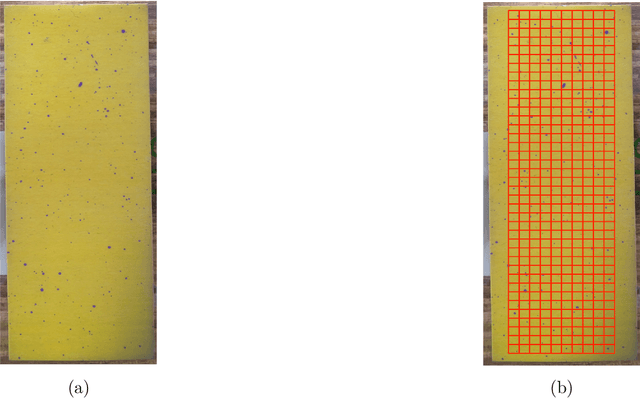
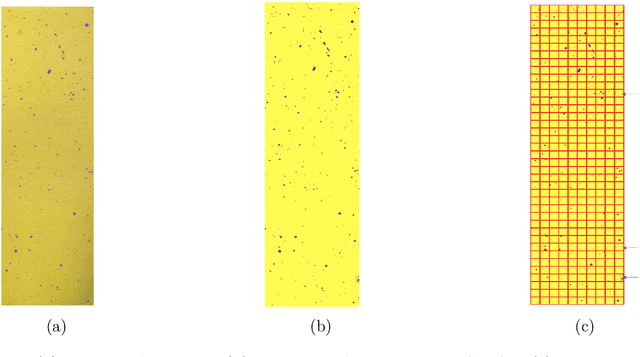
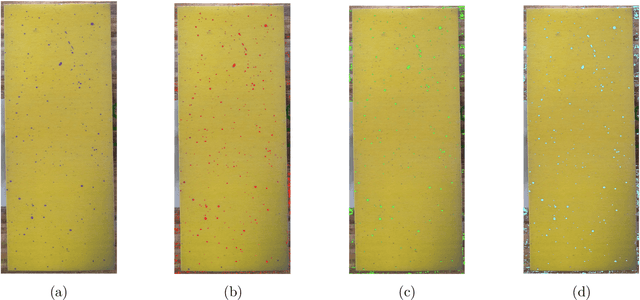
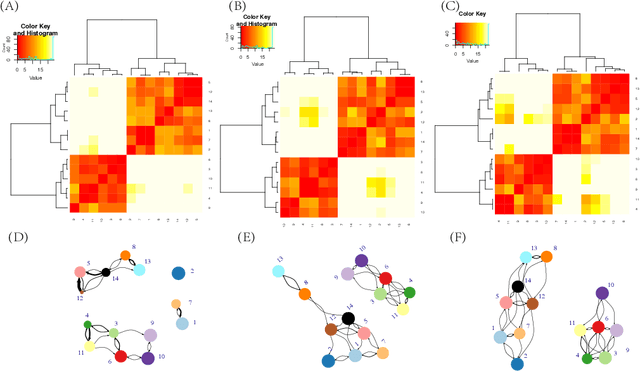
Targeted color-dots with varying shapes and sizes in images are first exhaustively identified, and then their multiscale 2D geometric patterns are extracted for testing spatial uniformness in a progressive fashion. Based on color theory in physics, we develop a new color-identification algorithm relying on highly associative relations among the three color-coordinates: RGB or HSV. Such high associations critically imply low color-complexity of a color image, and renders potentials of exhaustive identification of targeted color-dots of all shapes and sizes. Via heterogeneous shaded regions and lighting conditions, our algorithm is shown being robust, practical and efficient comparing with the popular Contour and OpenCV approaches. Upon all identified color-pixels, we form color-dots as individually connected networks with shapes and sizes. We construct minimum spanning trees (MST) as spatial geometries of dot-collectives of various size-scales. Given a size-scale, the distribution of distances between immediate neighbors in the observed MST is extracted, so do many simulated MSTs under the spatial uniformness assumption. We devise a new algorithm for testing 2D spatial uniformness based on a Hierarchical clustering tree upon all involving MSTs. Our developments are illustrated on images obtained by mimicking chemical spraying via drone in Precision Agriculture.