 Add to Chrome
 Add to Firefox
 Add to Edge
An Enhanced Projection Pursuit Tree Classifier with Visual Methods for Assessing Algorithmic Improvements
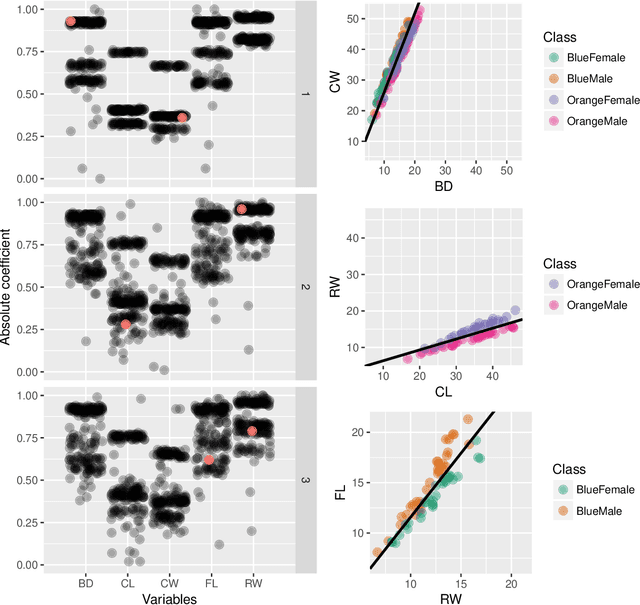
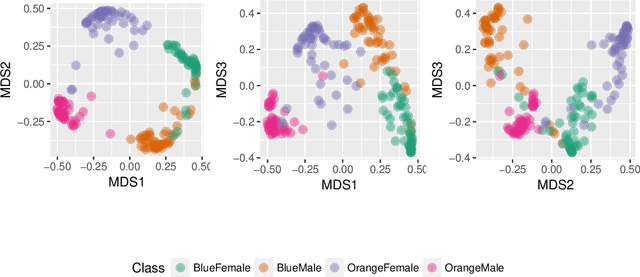
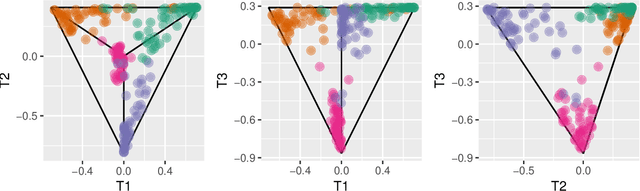
Feb 24, 2026This paper presents enhancements to the projection pursuit tree classifier and visual diagnostic methods for assessing their impact in high dimensions. The original algorithm uses linear combinations of variables in a tree structure where depth is constrained to be less than the number of classes -- a limitation that proves too rigid for complex classification problems. Our extensions improve performance in multi-class settings with unequal variance-covariance structures and nonlinear class separations by allowing more splits and more flexible class groupings in the projection pursuit computation. Proposing algorithmic improvements is straightforward; demonstrating their actual utility is not. We therefore develop two visual diagnostic approaches to verify that the enhancements perform as intended. Using high-dimensional visualization techniques, we examine model fits on benchmark datasets to assess whether the algorithm behaves as theorized. An interactive web application enables users to explore the behavior of both the original and enhanced classifiers under controlled scenarios. The enhancements are implemented in the R package PPtreeExt.
A Projection Pursuit Forest Algorithm for Supervised Classification
Jul 25, 2018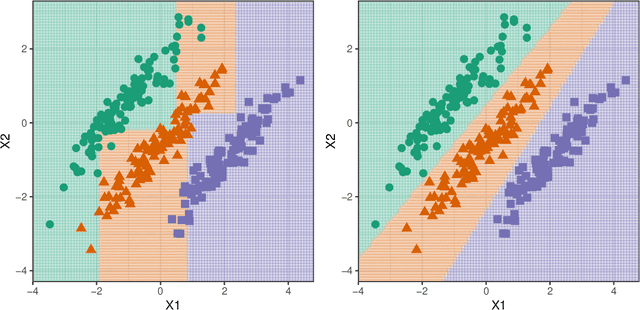
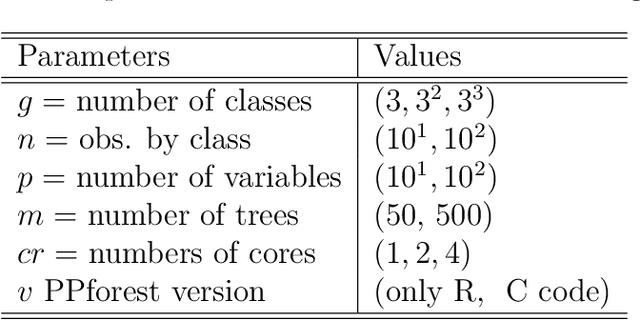
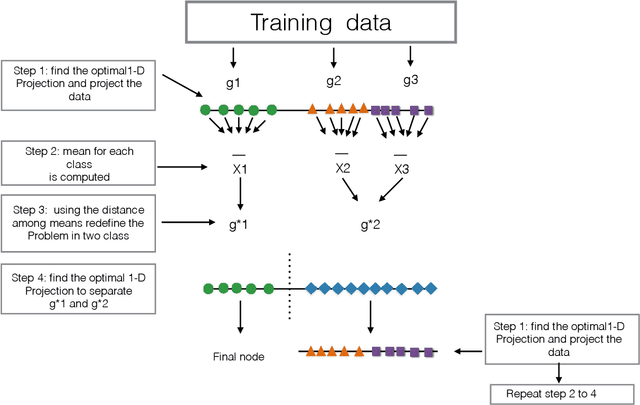
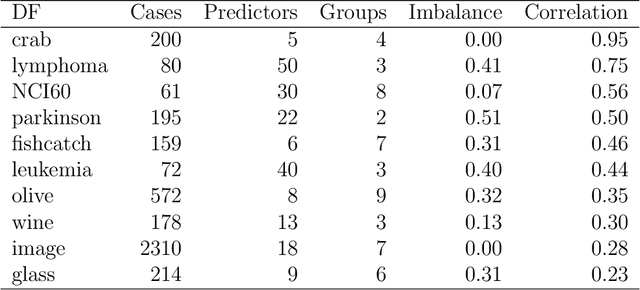
This paper presents a new ensemble learning method for classification problems called projection pursuit random forest (PPF). PPF uses the PPtree algorithm introduced in Lee et al. (2013). In PPF, trees are constructed by splitting on linear combinations of randomly chosen variables. Projection pursuit is used to choose a projection of the variables that best separates the classes. Utilizing linear combinations of variables to separate classes takes the correlation between variables into account which allows PPF to outperform a traditional random forest when separations between groups occurs in combinations of variables. The method presented here can be used in multi-class problems and is implemented into an R (R Core Team, 2018) package, PPforest, which is available on CRAN, with development versions at https://github.com/natydasilva/PPforest.
Interactive Graphics for Visually Diagnosing Forest Classifiers in R
Apr 08, 2017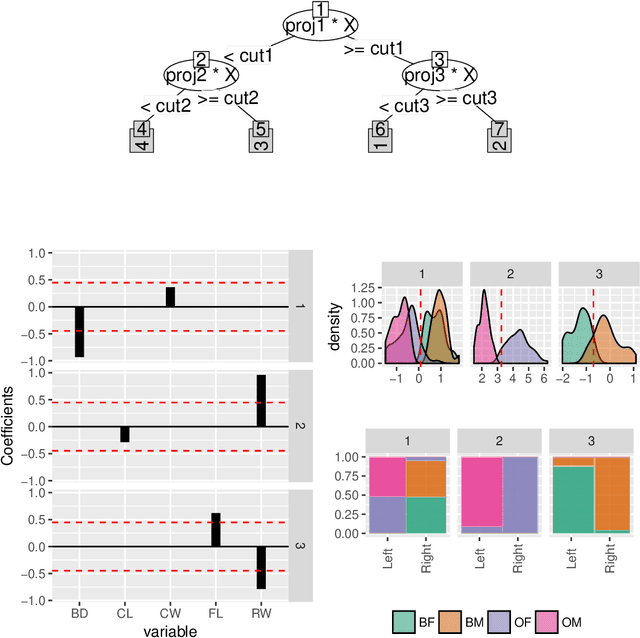
This paper describes structuring data and constructing plots to explore forest classification models interactively. A forest classifier is an example of an ensemble, produced by bagging multiple trees. The process of bagging and combining results from multiple trees, produces numerous diagnostics which, with interactive graphics, can provide a lot of insight into class structure in high dimensions. Various aspects are explored in this paper, to assess model complexity, individual model contributions, variable importance and dimension reduction, and uncertainty in prediction associated with individual observations. The ideas are applied to the random forest algorithm, and to the projection pursuit forest, but could be more broadly applied to other bagged ensembles. Interactive graphics are built in R, using the ggplot2, plotly, and shiny packages.