 Add to Chrome
 Add to Firefox
 Add to Edge
CHILI: Chemically-Informed Large-scale Inorganic Nanomaterials Dataset for Advancing Graph Machine Learning
Feb 21, 2024


Advances in graph machine learning (ML) have been driven by applications in chemistry as graphs have remained the most expressive representations of molecules. While early graph ML methods focused primarily on small organic molecules, recently, the scope of graph ML has expanded to include inorganic materials. Modelling the periodicity and symmetry of inorganic crystalline materials poses unique challenges, which existing graph ML methods are unable to address. Moving to inorganic nanomaterials increases complexity as the scale of number of nodes within each graph can be broad ($10$ to $10^5$). The bulk of existing graph ML focuses on characterising molecules and materials by predicting target properties with graphs as input. However, the most exciting applications of graph ML will be in their generative capabilities, which is currently not at par with other domains such as images or text. We invite the graph ML community to address these open challenges by presenting two new chemically-informed large-scale inorganic (CHILI) nanomaterials datasets: A medium-scale dataset (with overall >6M nodes, >49M edges) of mono-metallic oxide nanomaterials generated from 12 selected crystal types (CHILI-3K) and a large-scale dataset (with overall >183M nodes, >1.2B edges) of nanomaterials generated from experimentally determined crystal structures (CHILI-100K). We define 11 property prediction tasks and 6 structure prediction tasks, which are of special interest for nanomaterial research. We benchmark the performance of a wide array of baseline methods and use these benchmarking results to highlight areas which need future work. To the best of our knowledge, CHILI-3K and CHILI-100K are the first open-source nanomaterial datasets of this scale -- both on the individual graph level and of the dataset as a whole -- and the only nanomaterials datasets with high structural and elemental diversity.
Carbon Footprint of Selecting and Training Deep Learning Models for Medical Image Analysis
Mar 04, 2022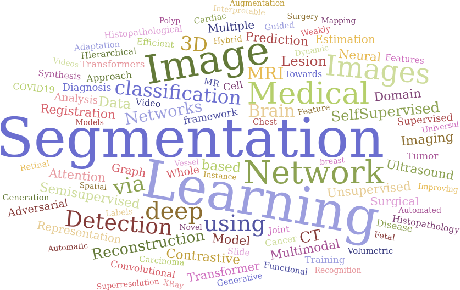
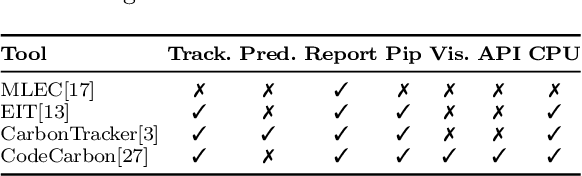
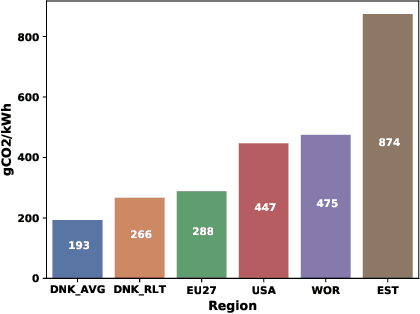
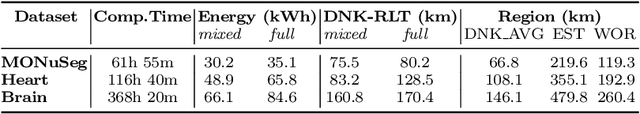
The increasing energy consumption and carbon footprint of deep learning (DL) due to growing compute requirements has become a cause of concern. In this work, we focus on the carbon footprint of developing DL models for medical image analysis (MIA), where volumetric images of high spatial resolution are handled. In this study, we present and compare the features of four tools from literature to quantify the carbon footprint of DL. Using one of these tools we estimate the carbon footprint of medical image segmentation pipelines. We choose nnU-net as the proxy for a medical image segmentation pipeline and experiment on three common datasets. With our work we hope to inform on the increasing energy costs incurred by MIA. We discuss simple strategies to cut-down the environmental impact that can make model selection and training processes more efficient.
The International Workshop on Osteoarthritis Imaging Knee MRI Segmentation Challenge: A Multi-Institute Evaluation and Analysis Framework on a Standardized Dataset
May 26, 2020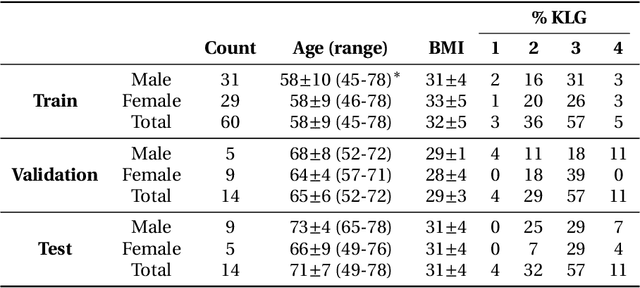
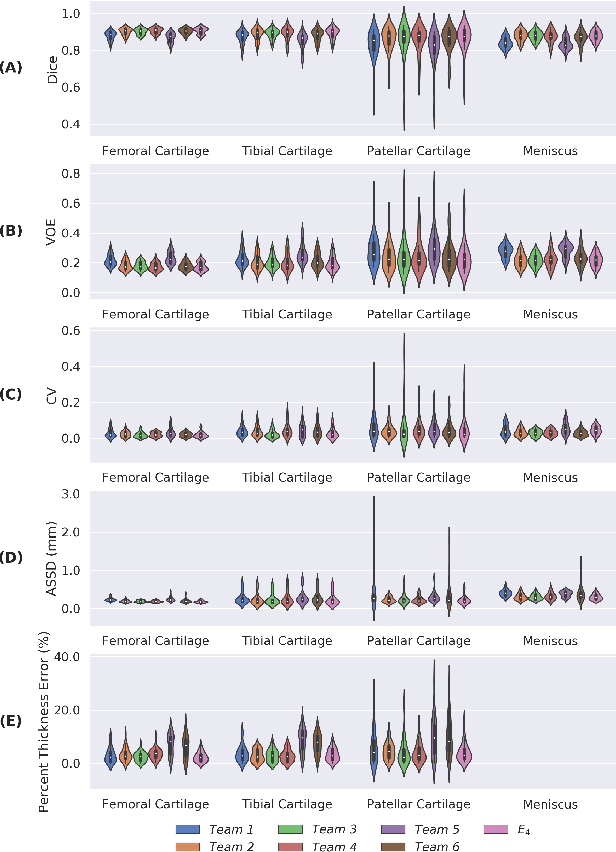
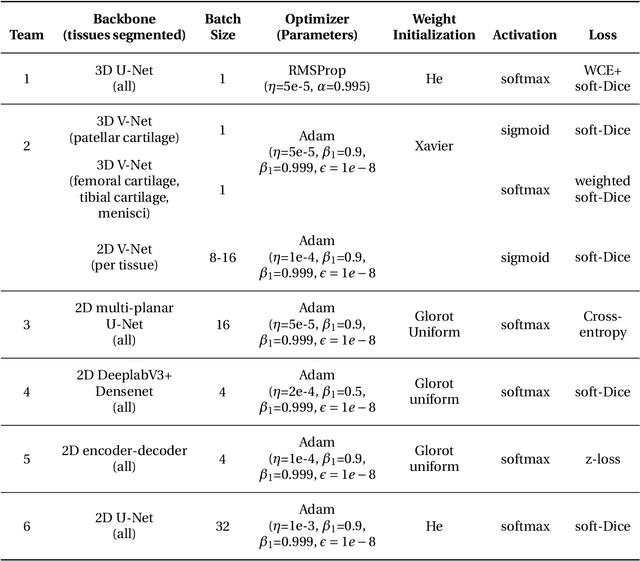
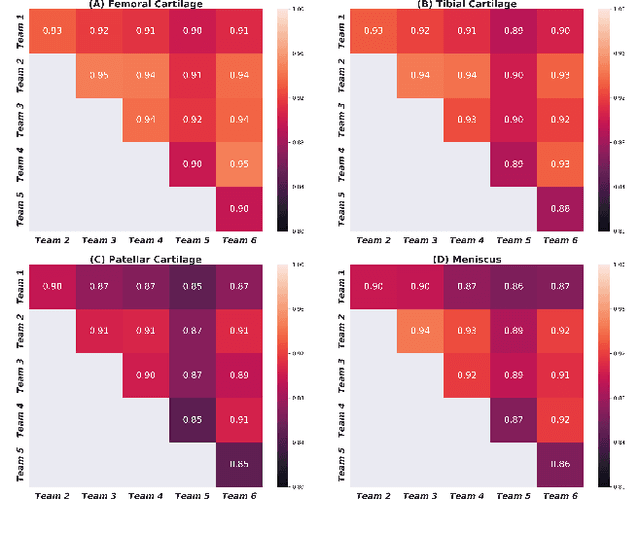
Purpose: To organize a knee MRI segmentation challenge for characterizing the semantic and clinical efficacy of automatic segmentation methods relevant for monitoring osteoarthritis progression. Methods: A dataset partition consisting of 3D knee MRI from 88 subjects at two timepoints with ground-truth articular (femoral, tibial, patellar) cartilage and meniscus segmentations was standardized. Challenge submissions and a majority-vote ensemble were evaluated using Dice score, average symmetric surface distance, volumetric overlap error, and coefficient of variation on a hold-out test set. Similarities in network segmentations were evaluated using pairwise Dice correlations. Articular cartilage thickness was computed per-scan and longitudinally. Correlation between thickness error and segmentation metrics was measured using Pearson's coefficient. Two empirical upper bounds for ensemble performance were computed using combinations of model outputs that consolidated true positives and true negatives. Results: Six teams (T1-T6) submitted entries for the challenge. No significant differences were observed across all segmentation metrics for all tissues (p=1.0) among the four top-performing networks (T2, T3, T4, T6). Dice correlations between network pairs were high (>0.85). Per-scan thickness errors were negligible among T1-T4 (p=0.99) and longitudinal changes showed minimal bias (<0.03mm). Low correlations (<0.41) were observed between segmentation metrics and thickness error. The majority-vote ensemble was comparable to top performing networks (p=1.0). Empirical upper bound performances were similar for both combinations (p=1.0). Conclusion: Diverse networks learned to segment the knee similarly where high segmentation accuracy did not correlate to cartilage thickness accuracy. Voting ensembles did not outperform individual networks but may help regularize individual models.
Lung Segmentation from Chest X-rays using Variational Data Imputation
May 20, 2020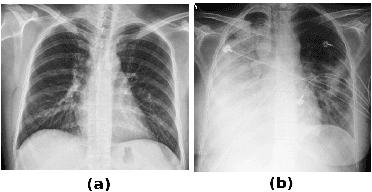
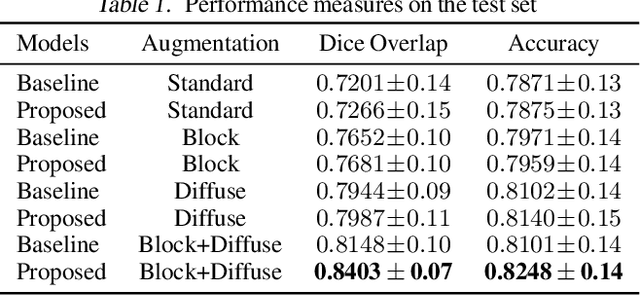
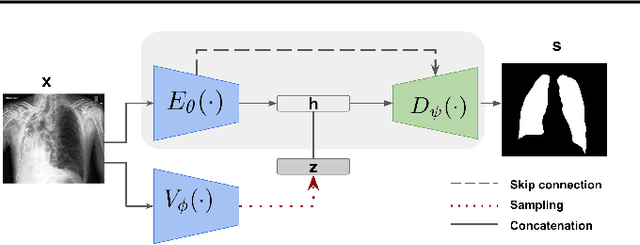
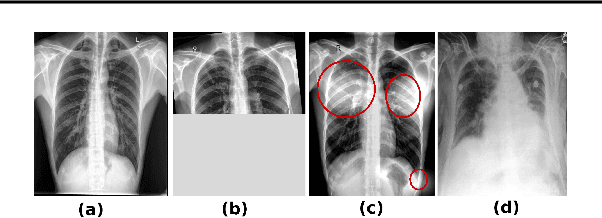
Pulmonary opacification is the inflammation in the lungs caused by many respiratory ailments, including the novel corona virus disease 2019 (COVID-19). Chest X-rays (CXRs) with such opacifications render regions of lungs imperceptible, making it difficult to perform automated image analysis on them. In this work, we focus on segmenting lungs from such abnormal CXRs as part of a pipeline aimed at automated risk scoring of COVID-19 from CXRs. We treat the high opacity regions as missing data and present a modified CNN-based image segmentation network that utilizes a deep generative model for data imputation. We train this model on normal CXRs with extensive data augmentation and demonstrate the usefulness of this model to extend to cases with extreme abnormalities.