 Add to Chrome
 Add to Firefox
 Add to Edge
An Automated Machine Learning Approach for Detecting Anomalous Peak Patterns in Time Series Data from a Research Watershed in the Northeastern United States Critical Zone
Sep 14, 2023


This paper presents an automated machine learning framework designed to assist hydrologists in detecting anomalies in time series data generated by sensors in a research watershed in the northeastern United States critical zone. The framework specifically focuses on identifying peak-pattern anomalies, which may arise from sensor malfunctions or natural phenomena. However, the use of classification methods for anomaly detection poses challenges, such as the requirement for labeled data as ground truth and the selection of the most suitable deep learning model for the given task and dataset. To address these challenges, our framework generates labeled datasets by injecting synthetic peak patterns into synthetically generated time series data and incorporates an automated hyperparameter optimization mechanism. This mechanism generates an optimized model instance with the best architectural and training parameters from a pool of five selected models, namely Temporal Convolutional Network (TCN), InceptionTime, MiniRocket, Residual Networks (ResNet), and Long Short-Term Memory (LSTM). The selection is based on the user's preferences regarding anomaly detection accuracy and computational cost. The framework employs Time-series Generative Adversarial Networks (TimeGAN) as the synthetic dataset generator. The generated model instances are evaluated using a combination of accuracy and computational cost metrics, including training time and memory, during the anomaly detection process. Performance evaluation of the framework was conducted using a dataset from a watershed, demonstrating consistent selection of the most fitting model instance that satisfies the user's preferences.
SOMTimeS: Self Organizing Maps for Time Series Clustering and its Application to Serious Illness Conversations
Aug 26, 2021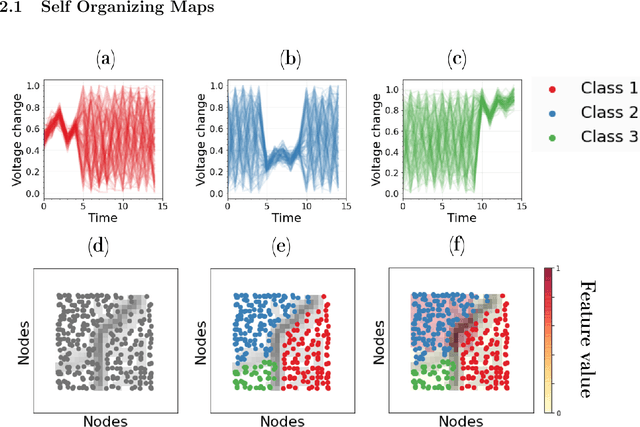
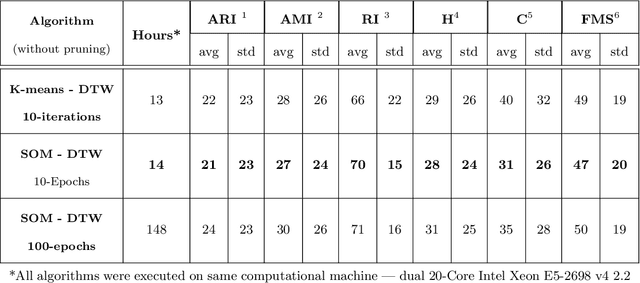
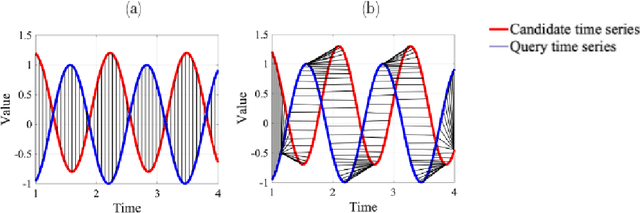
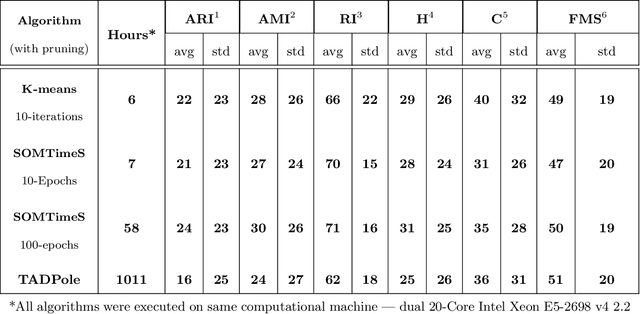
There is an increasing demand for scalable algorithms capable of clustering and analyzing large time series datasets. The Kohonen self-organizing map (SOM) is a type of unsupervised artificial neural network for visualizing and clustering complex data, reducing the dimensionality of data, and selecting influential features. Like all clustering methods, the SOM requires a measure of similarity between input data (in this work time series). Dynamic time warping (DTW) is one such measure, and a top performer given that it accommodates the distortions when aligning time series. Despite its use in clustering, DTW is limited in practice because it is quadratic in runtime complexity with the length of the time series data. To address this, we present a new DTW-based clustering method, called SOMTimeS (a Self-Organizing Map for TIME Series), that scales better and runs faster than other DTW-based clustering algorithms, and has similar performance accuracy. The computational performance of SOMTimeS stems from its ability to prune unnecessary DTW computations during the SOM's training phase. We also implemented a similar pruning strategy for K-means for comparison with one of the top performing clustering algorithms. We evaluated the pruning effectiveness, accuracy, execution time and scalability on 112 benchmark time series datasets from the University of California, Riverside classification archive. We showed that for similar accuracy, the speed-up achieved for SOMTimeS and K-means was 1.8x on average; however, rates varied between 1x and 18x depending on the dataset. SOMTimeS and K-means pruned 43% and 50% of the total DTW computations, respectively. We applied SOMtimeS to natural language conversation data collected as part of a large healthcare cohort study of patient-clinician serious illness conversations to demonstrate the algorithm's utility with complex, temporally sequenced phenomena.
A General Model of Conversational Dynamics and an Example Application in Serious Illness Communication
Oct 11, 2020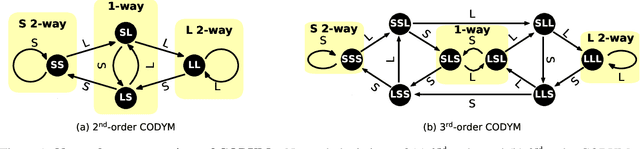
Conversation has been a primary means for the exchange of information since ancient times. Understanding patterns of information flow in conversations is a critical step in assessing and improving communication quality. In this paper, we describe COnversational DYnamics Model (CODYM) analysis, a novel approach for studying patterns of information flow in conversations. CODYMs are Markov Models that capture sequential dependencies in the lengths of speaker turns. The proposed method is automated and scalable, and preserves the privacy of the conversational participants. The primary function of CODYM analysis is to quantify and visualize patterns of information flow, concisely summarized over sequential turns from one or more conversations. Our approach is general and complements existing methods, providing a new tool for use in the analysis of any type of conversation. As an important first application, we demonstrate the model on transcribed conversations between palliative care clinicians and seriously ill patients. These conversations are dynamic and complex, taking place amidst heavy emotions, and include difficult topics such as end-of-life preferences and patient values. We perform a versatile set of CODYM analyses that (a) establish the validity of the model by confirming known patterns of conversational turn-taking and word usage, (b) identify normative patterns of information flow in serious illness conversations, and (c) show how these patterns vary across narrative time and differ under expressions of anger, fear and sadness. Potential applications of CODYMs range from assessment and training of effective healthcare communication to comparing conversational dynamics across language and culture, with the prospect of identifying universal similarities and unique "fingerprints" of information flow.
Analysis of Hydrological and Suspended Sediment Events from Mad River Wastershed using Multivariate Time Series Clustering
Nov 28, 2019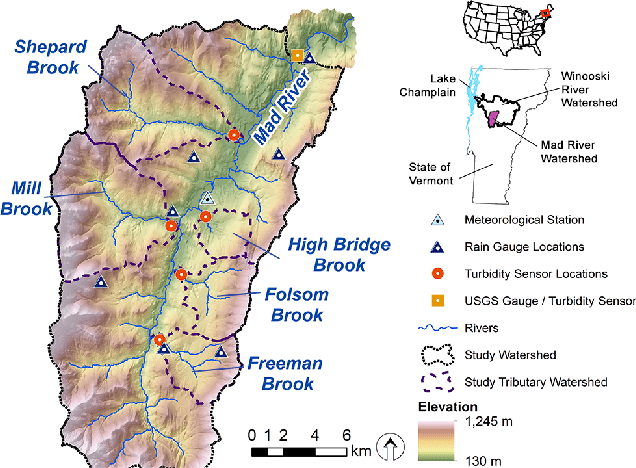
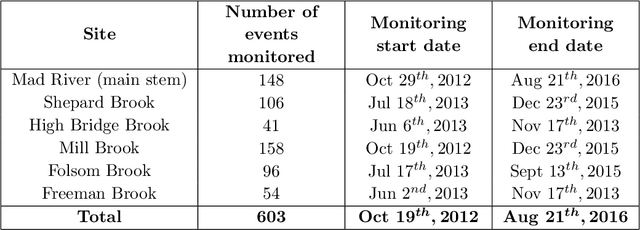
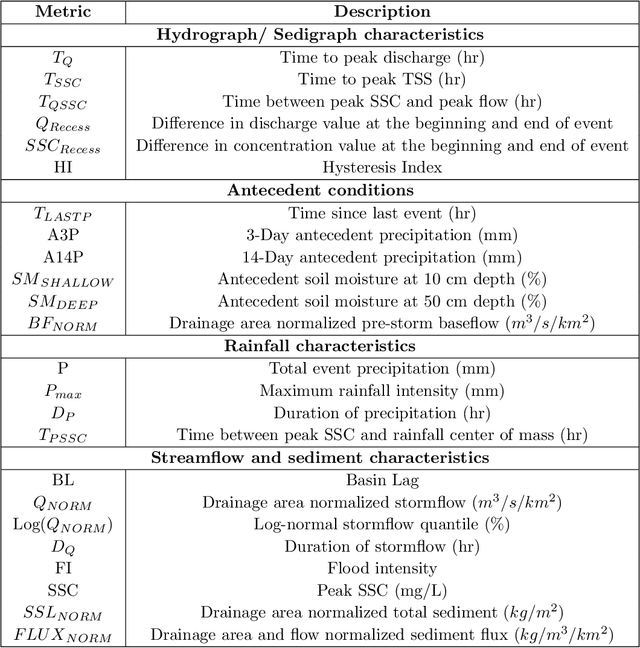
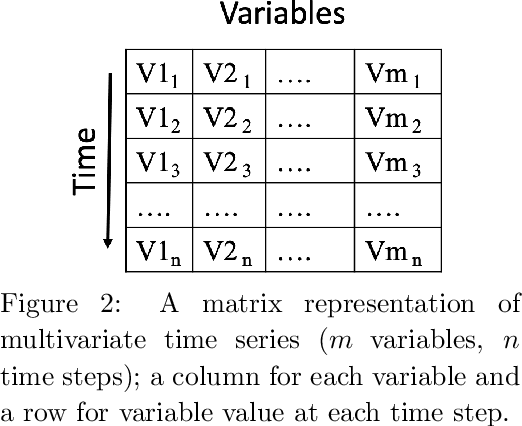
Hydrological storm events are a primary driver for transporting water quality constituents such as turbidity, suspended sediments and nutrients. Analyzing the concentration (C) of these water quality constituents in response to increased streamflow discharge (Q), particularly when monitored at high temporal resolution during a hydrological event, helps to characterize the dynamics and flux of such constituents. A conventional approach to storm event analysis is to reduce the C-Q time series to two-dimensional (2-D) hysteresis loops and analyze these 2-D patterns. While effective and informative to some extent, this hysteresis loop approach has limitations because projecting the C-Q time series onto a 2-D plane obscures detail (e.g., temporal variation) associated with the C-Q relationships. In this paper, we address this issue using a multivariate time series clustering approach. Clustering is applied to sequences of river discharge and suspended sediment data (acquired through turbidity-based monitoring) from six watersheds located in the Lake Champlain Basin in the northeastern United States. While clusters of the hydrological storm events using the multivariate time series approach were found to be correlated to 2-D hysteresis loop classifications and watershed locations, the clusters differed from the 2-D hysteresis classifications. Additionally, using available meteorological data associated with storm events, we examine the characteristics of computational clusters of storm events in the study watersheds and identify the features driving the clustering approach.