 Add to Chrome
 Add to Firefox
 Add to Edge
HydroGEM: A Self Supervised Zero Shot Hybrid TCN Transformer Foundation Model for Continental Scale Streamflow Quality Control
Dec 16, 2025


Real-time streamflow monitoring networks generate millions of observations annually, yet maintaining data quality across thousands of remote sensors remains labor-intensive. We introduce HydroGEM (Hydrological Generalizable Encoder for Monitoring), a foundation model for continental-scale streamflow quality control. HydroGEM uses two-stage training: self-supervised pretraining on 6.03 million sequences from 3,724 USGS stations learns hydrological representations, followed by fine-tuning with synthetic anomalies for detection and reconstruction. A hybrid TCN-Transformer architecture (14.2M parameters) captures local temporal patterns and long-range dependencies, while hierarchical normalization handles six orders of magnitude in discharge. On held-out synthetic tests comprising 799 stations with 18 expert-validated anomaly types, HydroGEM achieves F1 = 0.792 for detection and 68.7% reconstruction-error reduction, a 36.3% improvement over existing methods. Zero-shot transfer to 100 Environment and Climate Change Canada stations yields F1 = 0.586, exceeding all baselines and demonstrating cross-national generalization. The model maintains consistent detection across correction magnitudes and aligns with operational seasonal patterns. HydroGEM is designed for human-in-the-loop workflows - outputs are quality control suggestions requiring expert review, not autonomous corrections.
From Knowledge Generation to Knowledge Verification: Examining the BioMedical Generative Capabilities of ChatGPT
Feb 20, 2025The generative capabilities of LLM models present opportunities in accelerating tasks and concerns with the authenticity of the knowledge it produces. To address the concerns, we present a computational approach that systematically evaluates the factual accuracy of biomedical knowledge that an LLM model has been prompted to generate. Our approach encompasses two processes: the generation of disease-centric associations and the verification of them using the semantic knowledge of the biomedical ontologies. Using ChatGPT as the select LLM model, we designed a set of prompt-engineering processes to generate linkages between diseases, drugs, symptoms, and genes to establish grounds for assessments. Experimental results demonstrate high accuracy in identifying disease terms (88%-97%), drug names (90%-91%), and genetic information (88%-98%). The symptom term identification accuracy was notably lower (49%-61%), as verified against the DOID, ChEBI, SYMPTOM, and GO ontologies accordingly. The verification of associations reveals literature coverage rates of (89%-91%) among disease-drug and disease-gene associations. The low identification accuracy for symptom terms also contributed to the verification of symptom-related associations (49%-62%).
TransNAS-TSAD: Harnessing Transformers for Multi-Objective Neural Architecture Search in Time Series Anomaly Detection
Dec 03, 2023


The surge in real-time data collection across various industries has underscored the need for advanced anomaly detection in both univariate and multivariate time series data. Traditional methods, while comprehensive, often struggle to capture the complex interdependencies in such data. This paper introduces TransNAS-TSAD, a novel framework that synergizes transformer architecture with neural architecture search (NAS), enhanced through NSGA-II algorithm optimization. This innovative approach effectively tackles the complexities of both univariate and multivariate time series, balancing computational efficiency with detection accuracy. Our evaluation reveals that TransNAS-TSAD surpasses conventional anomaly detection models, demonstrating marked improvements in diverse data scenarios. We also propose the Efficiency-Accuracy-Complexity Score (EACS) as a new metric for assessing model performance, emphasizing the crucial balance between accuracy and computational resources. TransNAS-TSAD sets a new benchmark in time series anomaly detection, offering a versatile, efficient solution for complex real-world applications. This research paves the way for future developments in the field, highlighting its potential in a wide range of industry applications.
An Automated Machine Learning Approach for Detecting Anomalous Peak Patterns in Time Series Data from a Research Watershed in the Northeastern United States Critical Zone
Sep 14, 2023


This paper presents an automated machine learning framework designed to assist hydrologists in detecting anomalies in time series data generated by sensors in a research watershed in the northeastern United States critical zone. The framework specifically focuses on identifying peak-pattern anomalies, which may arise from sensor malfunctions or natural phenomena. However, the use of classification methods for anomaly detection poses challenges, such as the requirement for labeled data as ground truth and the selection of the most suitable deep learning model for the given task and dataset. To address these challenges, our framework generates labeled datasets by injecting synthetic peak patterns into synthetically generated time series data and incorporates an automated hyperparameter optimization mechanism. This mechanism generates an optimized model instance with the best architectural and training parameters from a pool of five selected models, namely Temporal Convolutional Network (TCN), InceptionTime, MiniRocket, Residual Networks (ResNet), and Long Short-Term Memory (LSTM). The selection is based on the user's preferences regarding anomaly detection accuracy and computational cost. The framework employs Time-series Generative Adversarial Networks (TimeGAN) as the synthetic dataset generator. The generated model instances are evaluated using a combination of accuracy and computational cost metrics, including training time and memory, during the anomaly detection process. Performance evaluation of the framework was conducted using a dataset from a watershed, demonstrating consistent selection of the most fitting model instance that satisfies the user's preferences.
Deep Semi-supervised Anomaly Detection with Metapath-based Context Knowledge
Aug 21, 2023


Graph anomaly detection has attracted considerable attention in recent years. This paper introduces a novel approach that leverages metapath-based semi-supervised learning, addressing the limitations of previous methods. We present a new framework, Metapath-based Semi-supervised Anomaly Detection (MSAD), incorporating GCN layers in both the encoder and decoder to efficiently propagate context information between abnormal and normal nodes. The design of metapath-based context information and a specifically crafted anomaly community enhance the process of learning differences in structures and attributes, both globally and locally. Through a comprehensive set of experiments conducted on seven real-world networks, this paper demonstrates the superiority of the MSAD method compared to state-of-the-art techniques. The promising results of this study pave the way for future investigations, focusing on the optimization and analysis of metapath patterns to further enhance the effectiveness of anomaly detection on attributed networks.
Establishing Trust in ChatGPT BioMedical Generated Text: An Ontology-Based Knowledge Graph to Validate Disease-Symptom Links
Aug 07, 2023Methods: Through an innovative approach, we construct ontology-based knowledge graphs from authentic medical literature and AI-generated content. Our goal is to distinguish factual information from unverified data. We compiled two datasets: one from biomedical literature using a "human disease and symptoms" query, and another generated by ChatGPT, simulating articles. With these datasets (PubMed and ChatGPT), we curated 10 sets of 250 abstracts each, selected randomly with a specific seed. Our method focuses on utilizing disease ontology (DOID) and symptom ontology (SYMP) to build knowledge graphs, robust mathematical models that facilitate unbiased comparisons. By employing our fact-checking algorithms and network centrality metrics, we conducted GPT disease-symptoms link analysis to quantify the accuracy of factual knowledge amid noise, hypotheses, and significant findings. Results: The findings obtained from the comparison of diverse ChatGPT knowledge graphs with their PubMed counterparts revealed some interesting observations. While PubMed knowledge graphs exhibit a wealth of disease-symptom terms, it is surprising to observe that some ChatGPT graphs surpass them in the number of connections. Furthermore, some GPT graphs are demonstrating supremacy of the centrality scores, especially for the overlapping nodes. This striking contrast indicates the untapped potential of knowledge that can be derived from AI-generated content, awaiting verification. Out of all the graphs, the factual link ratio between any two graphs reached its peak at 60%. Conclusions: An intriguing insight from our findings was the striking number of links among terms in the knowledge graph generated from ChatGPT datasets, surpassing some of those in its PubMed counterpart. This early discovery has prompted further investigation using universal network metrics to unveil the new knowledge the links may hold.
Graph Anomaly Detection with Graph Neural Networks: Current Status and Challenges
Oct 04, 2022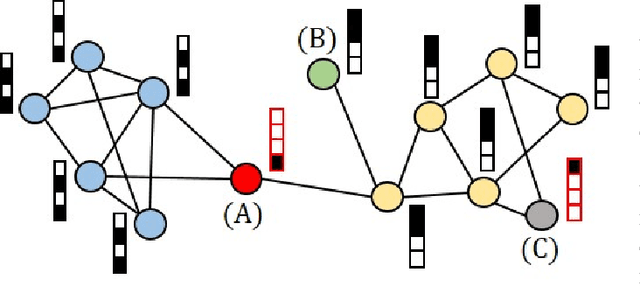
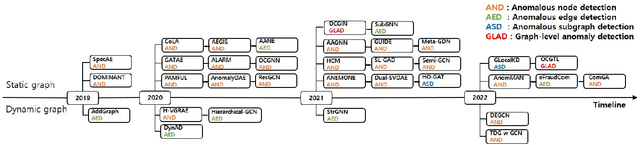
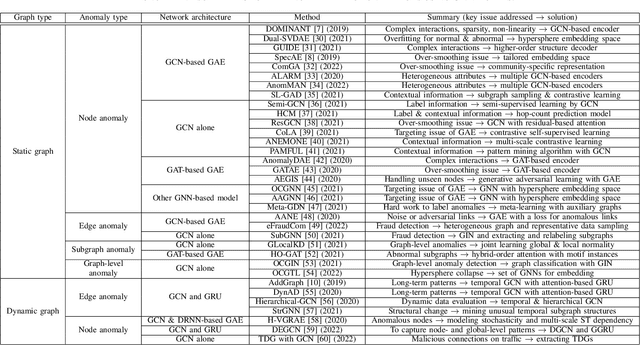
Graphs are used widely to model complex systems, and detecting anomalies in a graph is an important task in the analysis of complex systems. Graph anomalies are patterns in a graph that do not conform to normal patterns expected of the attributes and/or structures of the graph. In recent years, graph neural networks (GNNs) have been studied extensively and have successfully performed difficult machine learning tasks in node classification, link prediction, and graph classification thanks to the highly expressive capability via message passing in effectively learning graph representations. To solve the graph anomaly detection problem, GNN-based methods leverage information about the graph attributes (or features) and/or structures to learn to score anomalies appropriately. In this survey, we review the recent advances made in detecting graph anomalies using GNN models. Specifically, we summarize GNN-based methods according to the graph type (i.e., static and dynamic), the anomaly type (i.e., node, edge, subgraph, and whole graph), and the network architecture (e.g., graph autoencoder, graph convolutional network). To the best of our knowledge, this survey is the first comprehensive review of graph anomaly detection methods based on GNNs.
Adaptive Model Pooling for Online Deep Anomaly Detection from a Complex Evolving Data Stream
Jun 09, 2022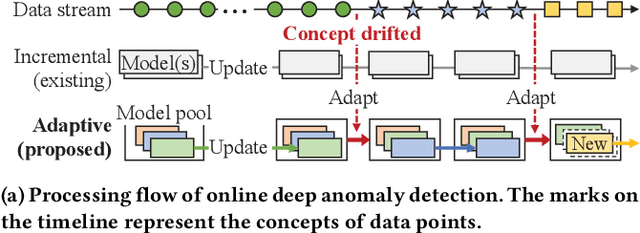
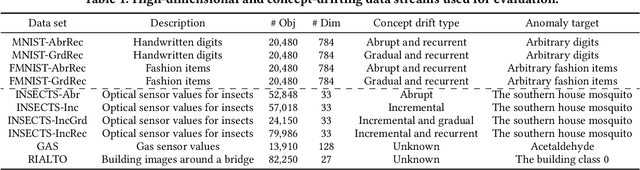
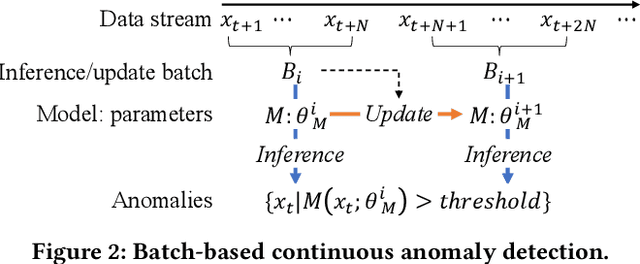
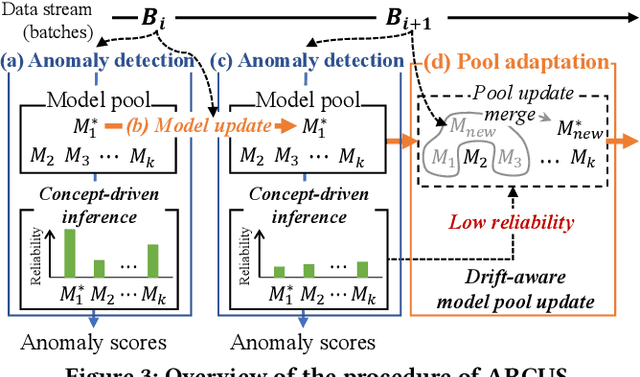
Online anomaly detection from a data stream is critical for the safety and security of many applications but is facing severe challenges due to complex and evolving data streams from IoT devices and cloud-based infrastructures. Unfortunately, existing approaches fall too short for these challenges; online anomaly detection methods bear the burden of handling the complexity while offline deep anomaly detection methods suffer from the evolving data distribution. This paper presents a framework for online deep anomaly detection, ARCUS, which can be instantiated with any autoencoder-based deep anomaly detection methods. It handles the complex and evolving data streams using an adaptive model pooling approach with two novel techniques: concept-driven inference and drift-aware model pool update; the former detects anomalies with a combination of models most appropriate for the complexity, and the latter adapts the model pool dynamically to fit the evolving data streams. In comprehensive experiments with ten data sets which are both high-dimensional and concept-drifted, ARCUS improved the anomaly detection accuracy of the streaming variants of state-of-the-art autoencoder-based methods and that of the state-of-the-art streaming anomaly detection methods by up to 22% and 37%, respectively.
SOMTimeS: Self Organizing Maps for Time Series Clustering and its Application to Serious Illness Conversations
Aug 26, 2021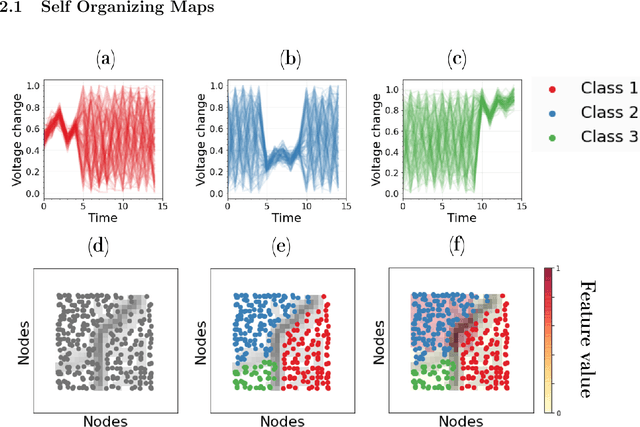
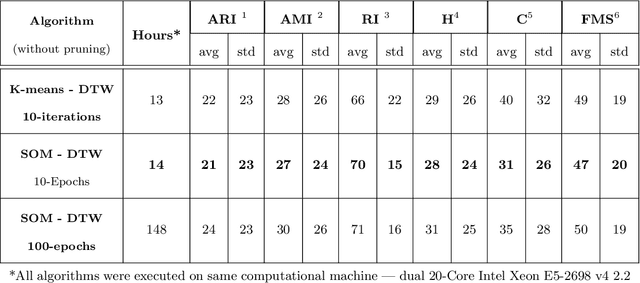
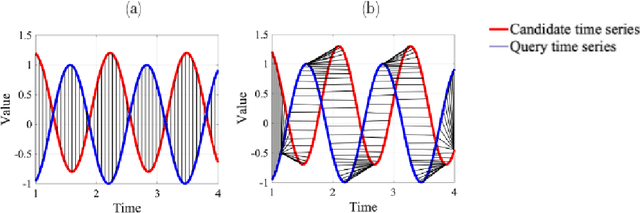
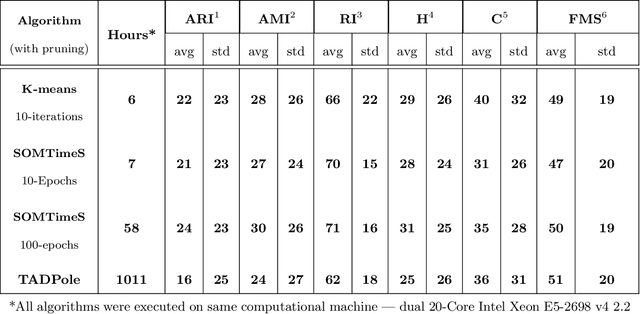
There is an increasing demand for scalable algorithms capable of clustering and analyzing large time series datasets. The Kohonen self-organizing map (SOM) is a type of unsupervised artificial neural network for visualizing and clustering complex data, reducing the dimensionality of data, and selecting influential features. Like all clustering methods, the SOM requires a measure of similarity between input data (in this work time series). Dynamic time warping (DTW) is one such measure, and a top performer given that it accommodates the distortions when aligning time series. Despite its use in clustering, DTW is limited in practice because it is quadratic in runtime complexity with the length of the time series data. To address this, we present a new DTW-based clustering method, called SOMTimeS (a Self-Organizing Map for TIME Series), that scales better and runs faster than other DTW-based clustering algorithms, and has similar performance accuracy. The computational performance of SOMTimeS stems from its ability to prune unnecessary DTW computations during the SOM's training phase. We also implemented a similar pruning strategy for K-means for comparison with one of the top performing clustering algorithms. We evaluated the pruning effectiveness, accuracy, execution time and scalability on 112 benchmark time series datasets from the University of California, Riverside classification archive. We showed that for similar accuracy, the speed-up achieved for SOMTimeS and K-means was 1.8x on average; however, rates varied between 1x and 18x depending on the dataset. SOMTimeS and K-means pruned 43% and 50% of the total DTW computations, respectively. We applied SOMtimeS to natural language conversation data collected as part of a large healthcare cohort study of patient-clinician serious illness conversations to demonstrate the algorithm's utility with complex, temporally sequenced phenomena.
A Benchmark Study on Time Series Clustering
Apr 26, 2020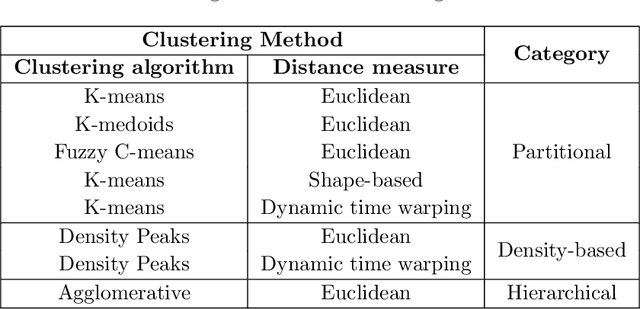
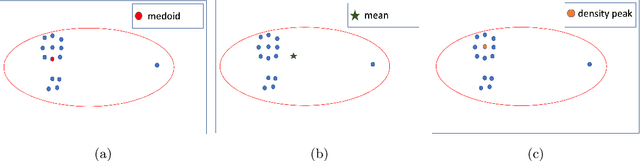
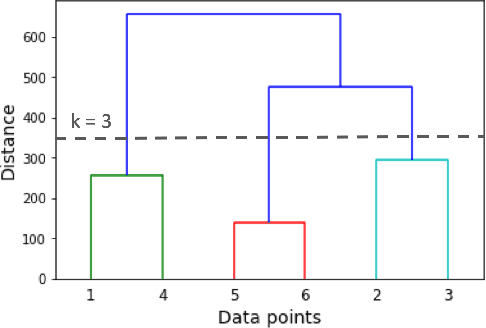
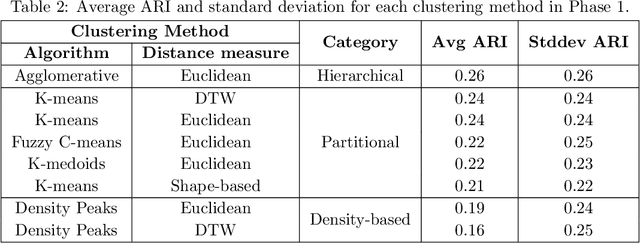
This paper presents the first time series clustering benchmark utilizing all time series datasets currently available in the University of California Riverside (UCR) archive -- the state of the art repository of time series data. Specifically, the benchmark examines eight popular clustering methods representing three categories of clustering algorithms (partitional, hierarchical and density-based) and three types of distance measures (Euclidean, dynamic time warping, and shape-based). We lay out six restrictions with special attention to making the benchmark as unbiased as possible. A phased evaluation approach was then designed for summarizing dataset-level assessment metrics and discussing the results. The benchmark study presented can be a useful reference for the research community on its own; and the dataset-level assessment metrics reported may be used for designing evaluation frameworks to answer different research questions.